inMarket


Recent Posts

Which Retailers Had the Most Returning Shoppers in Q3 2019?

October 24, 2019 / by inMarket

iStock-1131097418-1

With an estimated 75,000 stores expected to close by 2026, retailers are working harder than ever to find inventive ways to keep shoppers coming back. However, we need to also measure if these inventive strategies are working -- how we do that is observing when shoppers are regularly returning, as it’s a key indicator that the health of a business is in good shape. Businesses with high frequency index scores tend to be healthier than their low-scoring counterparts.

In this inMarket inSights Report, we’ve used first-party, SDK-verified location data of over 50 million Comscore-verified active users to analyze foot traffic patterns, historic device data, and real world trends at scale to show the biggest winners and losers in terms of frequency index.

Get the full results for this deep-dive report -- now available here.

Or, if you’re interested in how these frequency index scores shake out across other categories, please visit inmarket.com/insights.

How We Did It

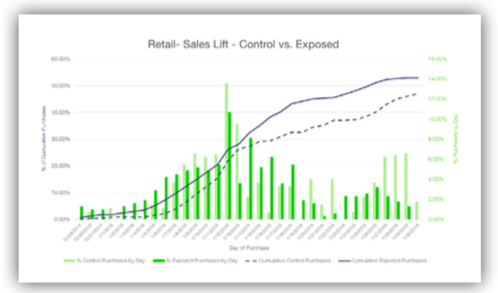
We've ranked non-grocery retailers based on the frequency with which their customers shop during the period from July through September 2019. Each retailer is assigned a frequency index which is determined by repeat device visitation and is normalized for comparability by month. For example, a retailer with 1,000,000 visits from 500,000 devices would have a loyalty score of 2, whereas a retailer with 10,000 visits from 4,000 devices would have a loyalty score of 2.5.

Note: The average loyalty score for all non-grocery retailers in Q3 2019 was 1.46.

Top 10 Retailers Based on Consumer Frequency Index

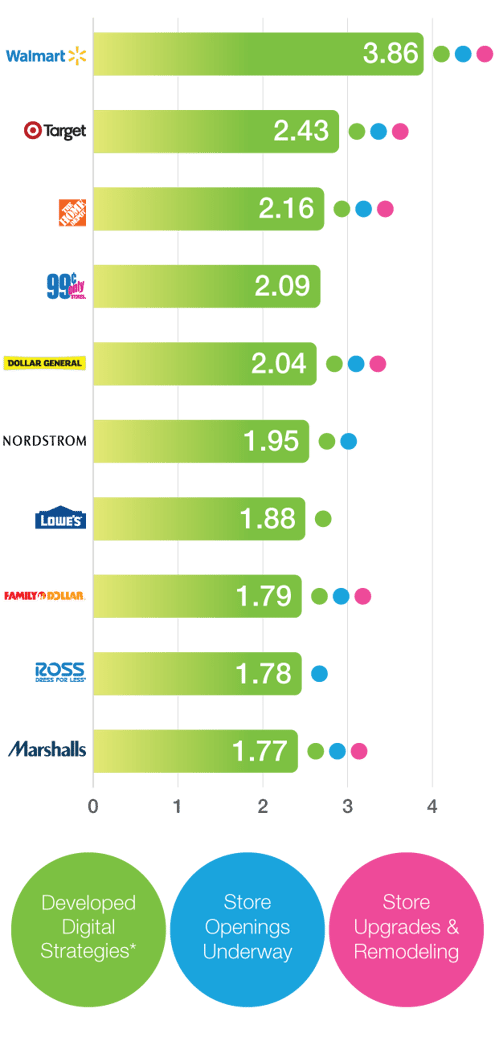
*Developed Digital Strategy defined as: Online purchases that can be picked up in-store, online purchases shipped-to-store, online to home delivery, same-day delivery, mobile checkout, apps, and/or Scan & Go mobile technology.

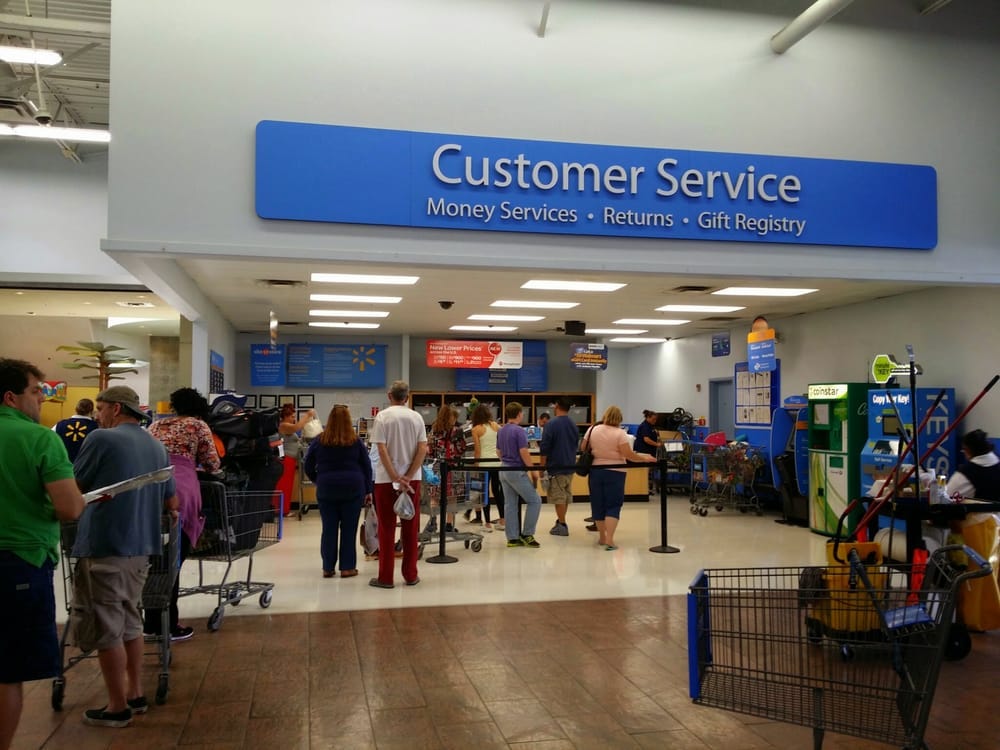
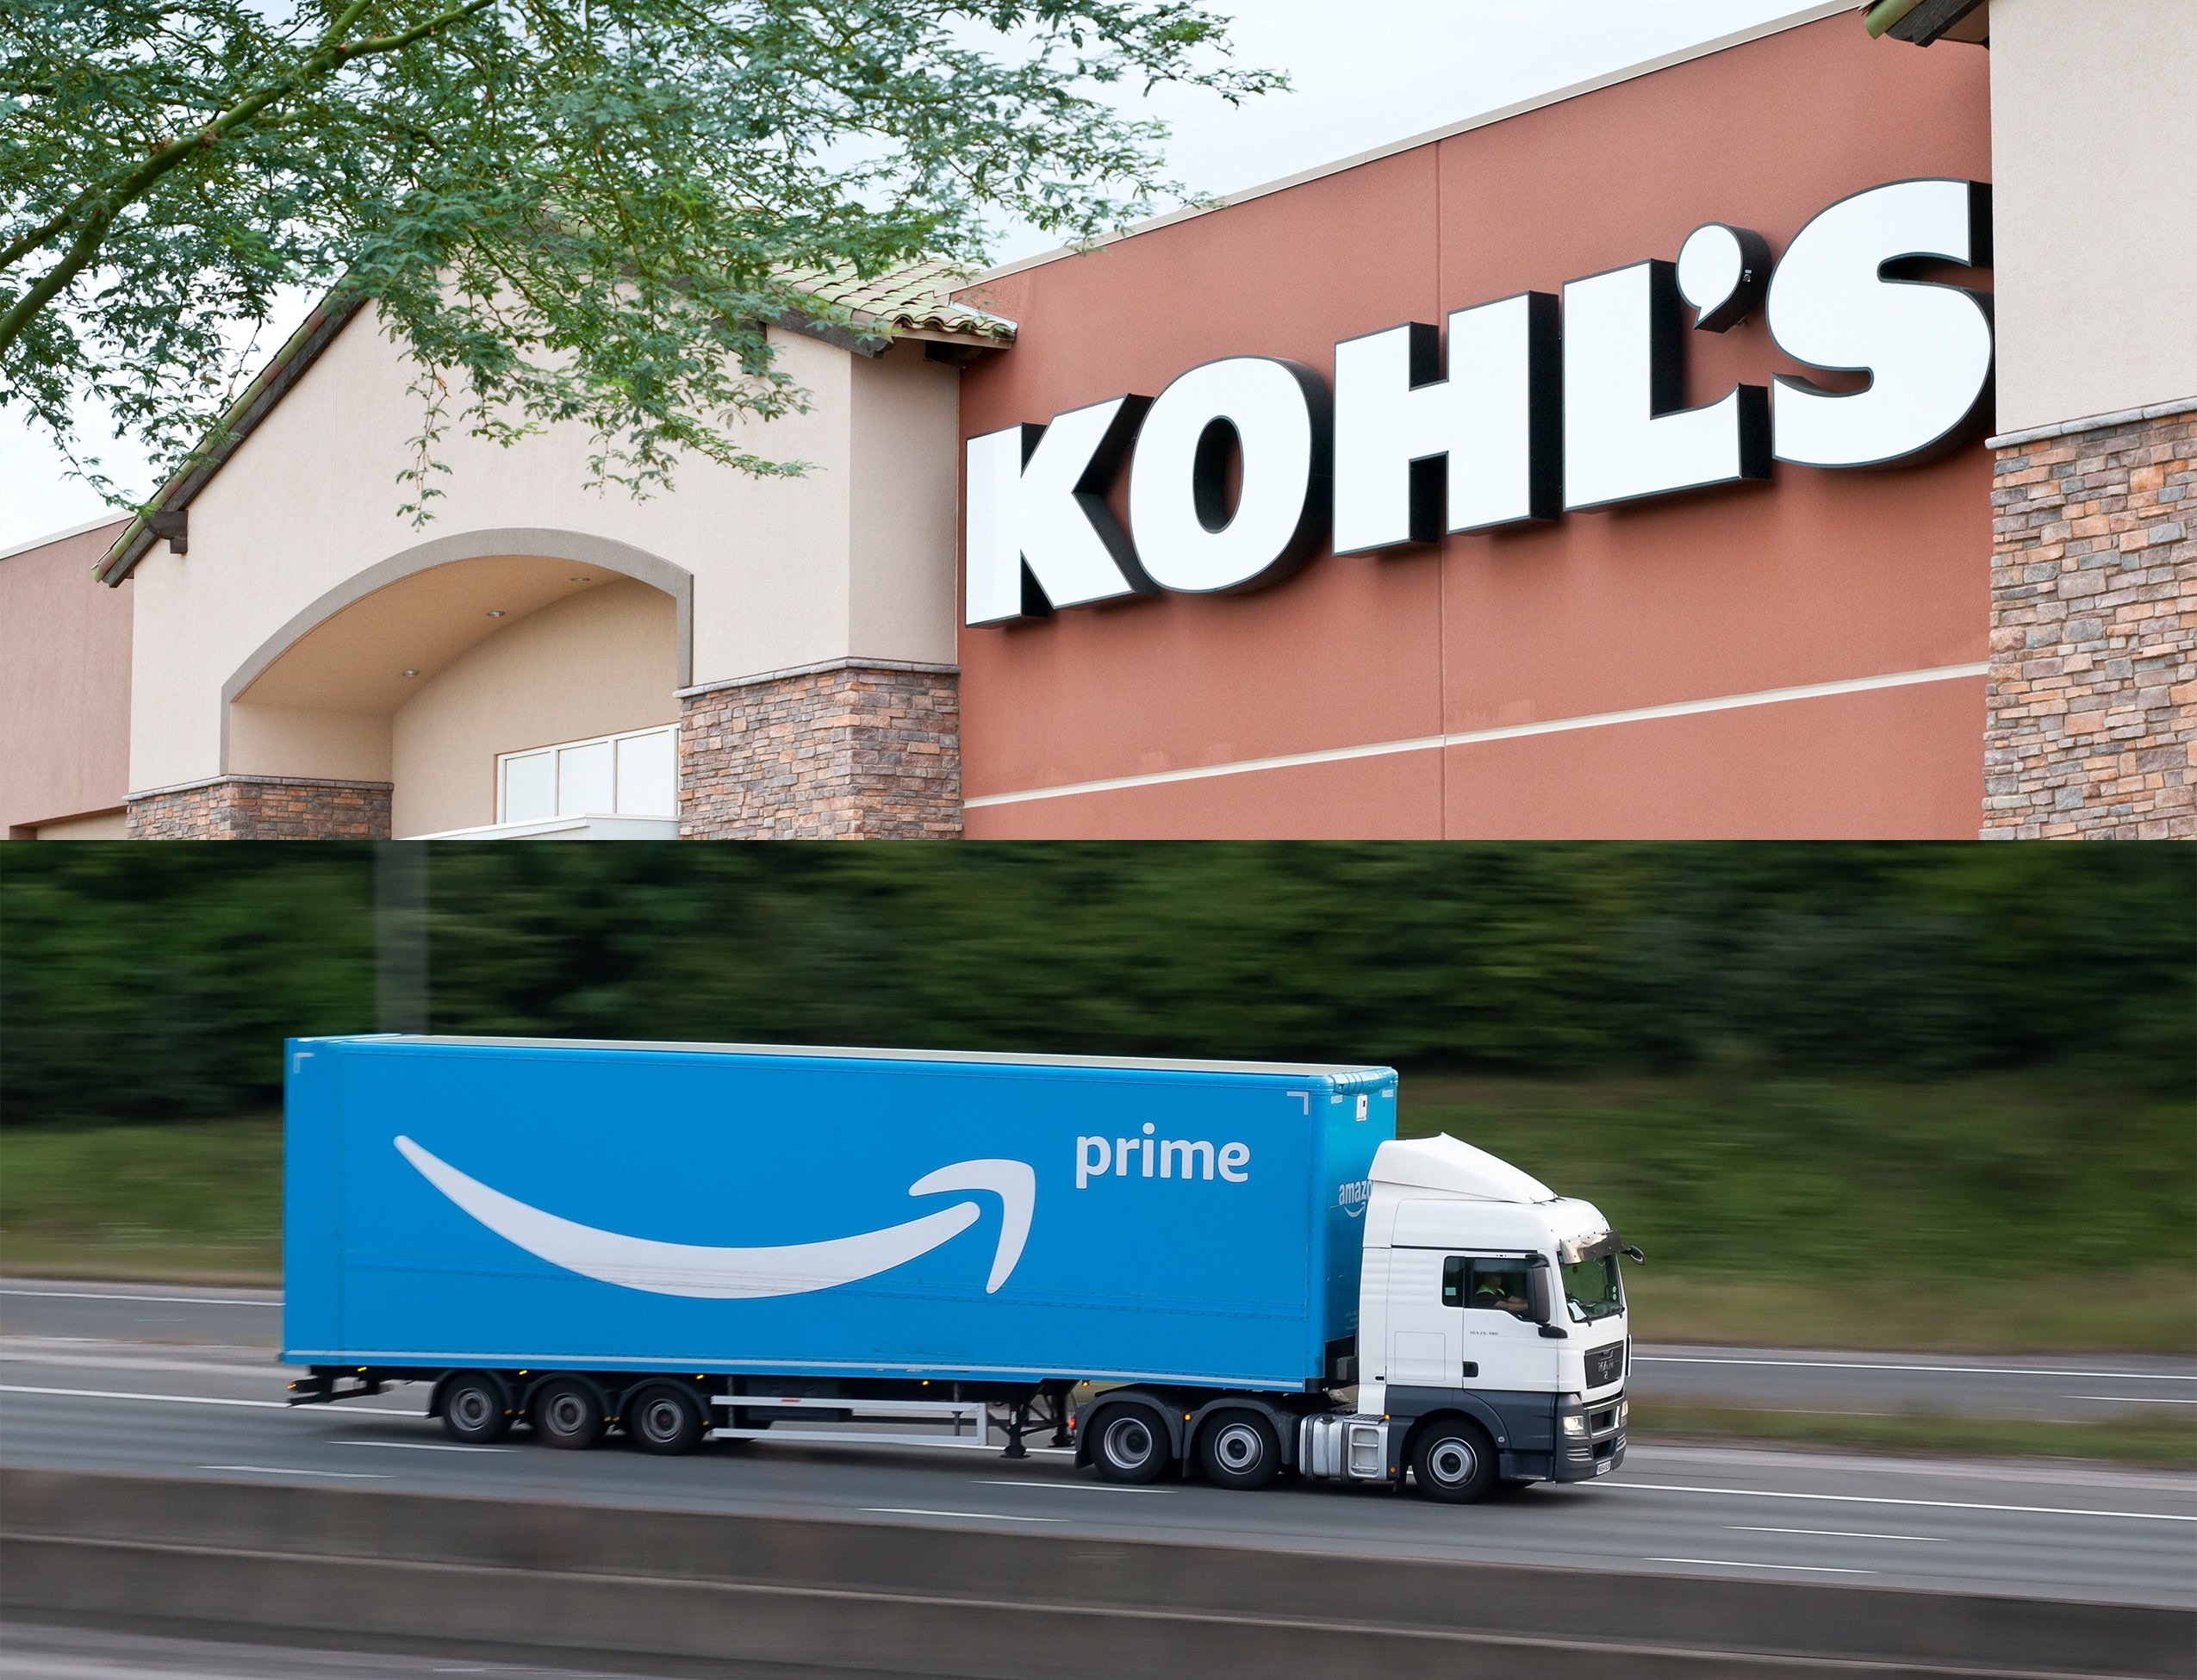
5 of the top 10 retailers are discount chains, indicating that shoppers are showing their cost-conscious behaviors through repeat visits to retailers focused on offering savings/everyday value. Off-price retailers are expanding: Ross on track to open 100 new stores and Marshalls has already opened 29 stores in 2019 (and growing).

Of the discount chains, 3 dollar store chains have higher frequency than the off-price discount retailers. Dollar stores are opening new locations and introducing fresh produce/perishables to compete with big box chains. This strategy of modeling themselves as a small-store version of a big box is working as more dollar store chains expand their reach: Dollar General ranked as the #1 retailer for opening stores this year with 975 new locations while Family Dollar plans on 500 new openings.

It’s no surprise that big box retailers like Walmart and Target have the highest frequency indexes. Both have strong digital strategies like their online purchase to in-store pick-ups and have been to go-to one-stop shop destination for shoppers that keep shoppers returning.

Among the top 10 are 2 home improvement chains. The Home Depot and Lowes have been investing in their online to in-store pick-up strategy and in-store experience -- and it seems to be working as shoppers are returning more frequently.

Nordstrom has also begun focusing on an omni-channel online to in-store strategy to bridge the digital and physical shopping experience. In addition, they’ve begun
expanding into new store formats like Nordstrom Local.


Bottom 10 Retailers Based on Consumer Frequency Index

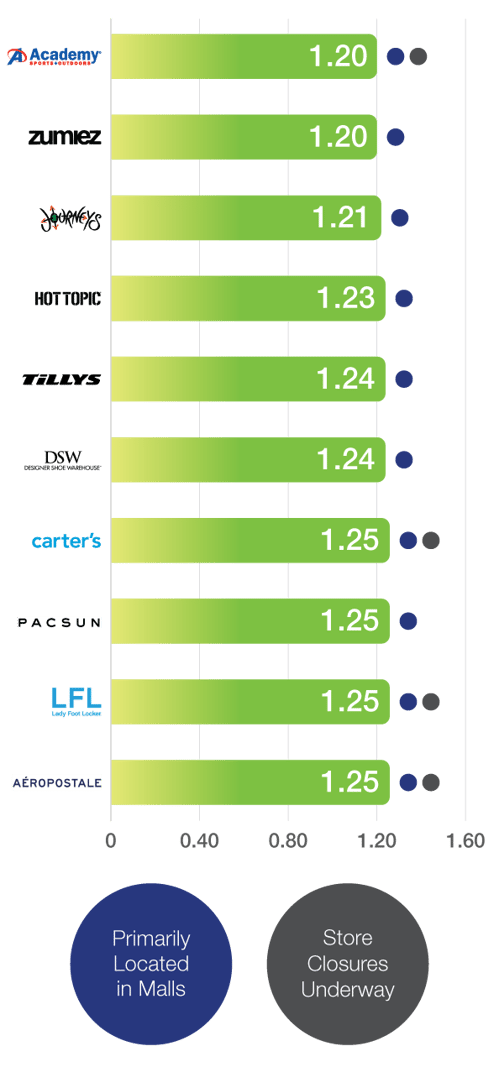
A majority of the bottom 10 retailers are
typically located in malls. As online and digital-first brands outpace traditional brick-and-mortar stores, malls are becoming less relevant and many are shuttering their doors. Fewer people are returning regularly to mall retailers, indicating a larger trend that businesses that don’t adapt to the changing purchasing habits of consumers could mean closing for good.

Carter’s, while reported to have strong revenue, has a lower frequency index. However, this doesn’t necessarily mean doom and gloom for this children’s retailer. As they focus more heavily on digital, they’re amping up their partnerships with Target and Walmart to sell their brand and have invested in their Amazon store as well.

Credit-rating agency Moody’s Investors Service has downgraded Academy Sports + Outdoors’ debt from B3 (judged as being speculative and a high credit risk) to Caa1 (rated as poor quality and very high credit risk), a result likely due to its inability to keep up with Amazon.

Foot Locker has announced that it would shutter 165 stores with one of the highest concentrations in Lady Foot Locker stores in the U.S.

Aéropostale, which has the lowest frequency, exited Chapter 11 in September 2016 and has not seemed to have fully recovered -- this clothing retailer now operates just 229 stores (in comparison to the 800 they previously operated) and are owned by mall operator, Simon Property Group.


So What? Why Should I Care?

Next to using a crystal ball, observing frequency indexes is one of the best predictors for determining the success of a retail chain and provides early insight into any symptoms that a business might be in trouble or showing emblems of good business health. Plus, customer retention is cheaper and potentially more lucrative than new customer acquisition, so measuring these real-time, changing visit is crucial to understanding repeat consumer behaviors.


Get the full results for this deep-dive report on Q3 2019 Retail Frequency Index Report -- now available here.

Want more inSights reports? Sign up at go.inmarket.com/subscribe or check out inmarket.com/insights.

To learn how your brand can connect with consumers on key milestone days, contact us today.


Read More

Bill Sussman, Digital Marketing Veteran, Joins inMarket as President

October 10, 2019 / by inMarket

LOS ANGELES and BENTONVILLE, Ark., Oct. 9, 2019 /PRNewswire/ -- inMarket, the leader in real-time and predictive advertising solutions, has hired veteran business leader Bill Sussman as President, effective immediately. In the new position based out of inMarket's Bentonville, AR office, Sussman will oversee sales, marketing and overall market-facing strategy for the rapidly growing company.

Across a 20+ year career leading digital marketing businesses, Sussman has shown a consistent record of exceeding aggressive goals and growing companies to become dominant market leaders. He brings a keen understanding of consumer behavior and digital technology as well as a solid background in business strategy, brand development and organizational scalability.

Sussman joins inMarket from 101 Ventures, where as CEO he oversaw three distinct shopper marketing businesses that grow CPG sales. Prior to 101, Sussman led Collective Bias from growth stage through acquisition as their President & CEO, was VP of Retail Development at Nickelodeon, and was the General Manager of Walmart and Sam's Club for Triad Digital.

"Bill's amazing leadership drove some of retail marketing's most impressive companies," said Todd Dipaola, CEO and Founder, inMarket. "His experience with world-class digital technologies, combined with his deep expertise across sales, marketing, and client strategy will help us continue to accelerate inMarket's unique growth and momentum in the space. We are excited to welcome Bill to the inMarket family."

Having worked with some of the most effective companies in integrated advertising, Sussman's industry leadership and results-oriented approach are a perfect fit for inMarket's rapid ascent. In 2019 alone, the company grew 66% year-over-year, acquired location-based marketing company ThinkNear, and was awarded Best Mobile Marketing Platform in the Digiday Technology Awards.

"inMarket has thrived by providing a full service location platform that leverages real-world physical movements to help advertisers better understand who consumers are, why they make decisions, and when to best reach them. inMarket's award-winning platform, deep data science expertise and incredible team helps advertisers sense and respond to consumers needs throughout the purchase process and during the moments that matter," said Bill Sussman, President, inMarket. "I'm incredibly excited to join this world-class team and build upon the success we drive on behalf of the world's biggest brands and agencies in the years to come."

About inMarket
inMarket is the leader in digital advertising and predictive location solutions that help brands sense and respond to consumer needs in real-time. Since 2010, inMarket has helped thousands of brands leverage SDK-derived, opt-in consumer data to better understand who consumers are, why they make decisions and how best to reach them. With inMarket's suite of solutions, brands can better understand consumers, activate real-time digital advertising in the moments that matter and generate better campaign attribution. inMarket's Moments solution drives an average of 5x the performance of traditional digital media and was a key factor in winning Best Mobile Marketing Platform at the 2019 Digiday Awards. inMarket, headquartered in Los Angeles, has offices in Atlanta, Bentonville, Chicago, New York and San Francisco. For more information, visit www.inmarket.com.

CONTACT: Dave Heinzinger, Dave@haymaker.co

SOURCE inMarket

Related Links

http://www.inmarket.com

https://www.prnewswire.com/news-releases/bill-sussman-veteran-digital-marketing-leader-joins-inmarket-as-president-300934501.html

Read More

Own the Holiday Season

September 20, 2019 / by inMarket

Own the Holiday Season

The Holiday Season is a critical time for brand advertisers. It can also be complicated and dynamic, requiring nuanced solutions in order to maximize campaign ROI. inMarket and Thinknear offer advanced solutions that enable advertisers to own the holiday shopping season.


Holiday Shopping Traffic

At inMarket, we’re constantly analyzing the retail visitation and purchase patterns of our 50MM Comscore verified SDK integrated U.S. consumers. This accurate and actionable data provides powerful digital advertising capabilities for our partner brands, while also revealing macro trends about purchase behavior at scale.

Through the lens of our massive historical data sets, we’ve identified the most important shopping dates based on the heaviest foot traffic in each retail category.


Black Friday

The first and largest shopping day of the season is almost mythical in its importance — at $12.5 billion in predicted sales1, the opportunity for marketers lives up to the hype. According to inMarket’s data, November sees a build up in foot traffic with each weekend greater than the last. Cyber Monday’s dip in foot traffic is not necessarily an occasion to drop advertising budgets, but rather pivot messaging to competing with online deals. This is the best period to reach holiday party enthusiasts, conquest competitors, and target heavy shoppers, gift researchers, and out-and-about shoppers.


Screen Shot 2019-08-28 at 12.21.52 PM


Screen Shot 2019-08-28 at 12.22.03 PM

Holiday Ramp Up

For those who missed the window to advertise
on Black Friday, there’s another opportunity: The three weeks leading up to the end of December is a high foot traffic period for consumers of all types. 43% of customers won’t make their first holiday purchase until after Cyber Monday — this group will be split amongst those who heavily research each and every gift and those who will rush to stores at the last possible moment (indicated by the largest spike post-Black Friday on December 23rd). These three weeks will be a critical time to conquest from your competition and direct heavy seasonal shoppers towards action.


Solutions for Owning the Holiday Season


Reach Holiday Party Enthusiasts

Holiday Party EnthusiastsWe all know at least one: the consummate party planner. This user is not typically not just the center of the party, but the planner of it. U.S. consumers will on average spend $215* on non-gift holiday purchases (such as food and decorations)1. Leveraging the power of inMarket’s suite of products, marketers can reach those engaged in holiday revelry prior to, during, and after their party supply runs. In addition, inMarket is capable of expanding targeting to reach consumers who have already been identified as party planners. Historic visitation-based targeting can be leveraged in hand with Preceptivity to reach those who have made similar trips before, all while targeting media the day (or days) leading up to their trip.

Conquest Competitors

Conquest CompetitorsA perennial strategy, targeting the areas around your competitors’ store locations is no longer limited to mere GeoFencing. GeoCookie & Preceptivity can be used in tandem to reach those who have previously been to competitive storefronts as well as preempted user’s journeys to competitors by strategic pre-visit messaging. Purchase behaviors and propensities are also usable as targeting criteria with Audiences. Finally, with Moments, marketers are able to launch digital takeovers of entire screens within store locations to maximize your hold on consumers’ attention and cut through the clutter of massive holiday messaging efforts.

Active Shopper Acquisition

Active Shopper AcquisitionThe holiday season is one that raises market demand for consumers’ attention dramatically. Optimizing the efficacy and readiness to deploy messaging across each step of the consumer’s journey will be paramount for any brand. From holiday downtime at home, where consumers can be targeted based on anything from demographics to affinities, inMarket can utilize increasingly tactical and local methods for reaching your ideal customer. For example, a customer reached through Audiences or Preceptivity at home can then pass through a wide GeoFence around a store location (another touch point) and be served messaging again upon entering the store.

Gift Researcher Targeting

Gift Researcher TargetingMany approach holiday gift giving with analytical zeal unmatched by some of the savviest researchers — as many as 47% of US consumers will find inspiration for their top holiday gifts online2. Two-thirds of users will then research on their mobile device prior to making a purchase for the holidays2. Owning this real estate is of the utmost importance to increasing your awareness, engagement, and purchase propensity. Use GeoAudience as well as Preceptivity to reach these consumers prior to their journey to purchase gifts they have researched. inStore or inHand Moments can be used further influence users with value-based messaging that is important to this group.

Heavy Seasonal Shoppers

Heavy Seasonal Shoppers

The average consumer will spend $313 on gifts for family and friends2; however, there will always be those who spend much, much more (and often add to significantly higher value for brands). GeoAudience can be used to target those who spend more than that, or GeoCookie for customers based on frequency of visit. Owning the digital geography of key, high-traffic retailers will be necessary for brands vying for these frequently high-spending consumers.

SOURCES:
1.) National Retail Federation; 2018 Annual November Holiday Consumer Survey (Conducted by Prosper Insights & Analytics)

2.) De Cunha, Margot; 14 Holiday Shopping Stats to Help You Plan in 2019 (WordStream)


Screen Shot 2019-09-12 at 12.11.36 PM

The Holiday Season is a critical time for brand advertisers. It can also be complicated and dynamic, requiring nuanced solutions in order to maximize campaign ROI. inMarket and Thinknear offer advanced solutions that enable advertisers to own the holiday shopping season. Now, with two leaders under one roof, you can own the holidays through vastly increased scale of now over 150 million unique devices, expansive new data sources around behaviors and motivations, and far more granular targeting.


Metric to Prove ROI

  • Sales Lift
  • Purchase Intent Lift
  • Brand Awareness Lift
  • Foot Traffic Lift
  • CTR
  • Strategic Campaign Insights
 
Read More

inMarket Awarded Best Mobile Marketing Platform

August 22, 2019 / by inMarket

Digiday Header v3

We are excited and humbled to have been named the BEST MOBILE MARKETING PLATFORM in the 2019 Digiday awards. As the finalist pool was made up of the best and most respected vendors in the space, we are especially grateful for this honor. 
 
We appreciate this recognition of all of our hard work and perseverance to provide world-class solutions for our clients. It has been an amazing ten years serving each and every one of you and we look forward to our future together!
View the Announcement and Additional Categories

The inMarket Difference
Screen Shot 2019-08-22 at 9.37.04 AM
 
Learn More


Read More

Kohl’s is Accepting Amazon Returns. How Much Did They Benefit?

August 15, 2019 / by inMarket

kohls

While Amazon Lockers have been popping up everywhere from Whole Foods to even Chase Banks, Amazon introduced a new kind of partnership just one week before Amazon Prime Days: Kohl’s announced that starting July 8, 2019 it would begin accepting Amazon returns, making the process of returns easier than ever.

While the ease of returns is an attractive selling point on its own to boost foot traffic for Kohl’s, Amazon’s yearly sale, Amazon Prime Days, began exactly one week later, drawing in even more feet through doors due to a higher number of returns than compared to typical days. While this partnership with Amazon feels like a win for Kohl’s, we investigated and measured exactly how much of a success this was for this department store chain.

Get the full results for this deep-dive report on Kohl’s +Amazon Partnership Report — now available here.

How We Did It

We looked at Kohl’s shoppers who spent 5 minutes or less in stores, and then analyzed this group’s foot traffic average for 3 weeks prior to the start of Amazon returns, and compared it to the 3 weeks after the day Kohl’s began accepting Amazon returns. Then, we determined the percent difference between the pre and post-Amazon return averages.

Kohl’s Foot Traffic: Before vs. After Amazon Returns

Total visit average 3 weeks prior vs. 3 weeks after Kohl’s began accepting Amazon returns

  • When comparing average total visits before vs. average total visits for Kohl’s after they began accepting Amazon returns, the average went up 23.66%.
  • Trips of 5 minutes of less increased by 17.06% after Kohl’s began accepting Amazon returns. This is likely because shoppers wouldn’t have had enough time to shop around and make a purchase in this time frame, but would have had time for a quick in-and-out visit to drop off packages.

Daily Visits to Kohl’s by Dwell Time Group

  • There’s a very clear up and to the right pattern for increase in visits after Kohl’s began accepting Amazon returns.
  • The highest spike in foot traffic falls on Saturday, July 27, which is the second weekend after Amazon Prime Days. The second highest day is Sunday, July 28, making this weekend the busiest weekend for foot traffic.
  • The weekend following Amazon Prime Days also sees high foot traffic days, outperforming previous weekend foot traffic in this period.
  • These spikes are likely due to a case of “buyer’s remorse.” Amazon shoppers are stopping in to return their purchases post-sale frenzy.

How We Did It

inMarket used first-party, SDK-derived location data of over 50 million Comscore-verified active users to first identify micro visit shoppers based on how long they stay in a location, then analyzed their foot traffic patterns to see if Kohl’s Amazon partnership had any effect on the number of visits.

So What? Why Should I Care?

Next to using a crystal ball, observing foot traffic patterns is one of the best predictors for consumer behavior and retail chain strategy. Measuring these real-time movements is crucial because it provides an extra dimension of observation and early visibility into how strategic partnerships might affect the direction in which the retail industry will move.


Get the full results for this deep-dive report on Kohl’s +Amazon Partnership Report — now available here.

Want more inSights reports? Sign up at go.inmarket.com/subscribe or check out inmarket.com/insights.

To learn how your brand can connect with consumers on key milestone days, contact us today.

Check out our other articles:

Read More

inMarket Acquires Thinknear - Two location leaders now under one family

August 8, 2019 / by inMarket


We’ve been growing consistently for the past decade and have just completed our biggest year and biggest quarter ever. Our goal has always been to provide the most accurate, responsive, and scalable strategies to help you grow. This is why we have consistently delivered new, innovative and exclusive solutions that help you reach and exceed aggressive KPIs. 

To continue exceeding your expectations, we’re excited to announce that we’ve acquired Thinknear -- another veteran, top performing location technology leader. Our new combined family will deliver even more performance, value and exclusive capabilities. We aim to continue to be the highest performers and most complete solution for your consumer marketing needs. 

Why this is important for inMarket clients:


  • inMarket clients will gain access to all of Thinknear’s products such as Geotype and Geolink, as well as legendary location score performance.
  • inMarket clients will gain new options to serve their needs via best-in-class managed as well as self-service platforms that lead performance benchmarks for ROI, viewability, and other measurement KPIs.
  • inMarket clients will continue to have access to all of our advanced media, including Moments, Preceptivity and Audiences.
  • inMarket clients will continue to have access to advanced insights and campaign measurement services derived from our 50 million Comscore verified smartphone integrations. 
  • inMarket clients will be able to continue working with the same award-winning sales, account management and ad-ops teams that have helped them drive successful campaign results over the past decade. 

For more information on inMarket, Thinknear, or to ask questions about how this will affect your account and goals, simply follow the links below.

Read The inMarket Press Release

Read The Thinknear Press Release

Contact us for more information

Read More

Q4 2019 Foot Traffic Predictions

August 5, 2019 / by inMarket

With Q4 nearing with each day, brands know that the holiday season is a massive opportunity to end the year strong. Consumers show their demand for specific retail categories with their feet, and by observing their patterns, brands are able to time their media spend to connect with consumers at the peak of their receptivity and therefore maximize the ROI from their campaigns.

In this Q4 2019 report, we’re using first-party location data from 50 million smartphone owners to map the months during winter. We’ve surfaced key opportunities for brands from October to December based on the heaviest foot traffic in each retail category in order to boost ROI.

Black Friday

Although Black Friday is touted as the biggest shopping day of the season, holiday shopping still reigns supreme. Only Department stores see its highest spike on this price-slashing day, while Big Box, Drug Stores, and Discount chains see its highest foot traffic the days leading up to Christmas.

Cyber Monday

Cyber Mondays see fairly lower than average foot traffic, confirming that consumers are where this shopping day states — online.

Pre-Christmas

While spikes in weekend foot traffic is expected, many shoppers are still in the habit of procrastinating. Brands looking to connect with the highest number of shoppers have a great opportunity to advertise on the Friday, Saturday and Sunday before Christmas.

Post-Christmas

The days after Christmas see a dip, but sustain higher than average pre-holiday foot traffic levels. This is likely due to shoppers going to stores to return unwanted gifts or cashing out gift cards. Interestingly, Discount stores don’t see as high an increase post-Christmas, likely because some Discount stores don’t offer gift cards or don’t accept returns for items.

Mega Millions

Convenience chains saw their highest foot traffic day in Q4 2018 during the Friday before the Mega Millions winner announcement. Many shoppers visited convenience stores with their fingers crossed to buy the winning ticket. The days leading up to large-figure lottery drawings are great times to connect with C-store shoppers.

How We Did It

inMarket’s first-party, SDK derived location insights platform measured foot traffic spikes and dips around key days for retailers using 50 million comScore-verified monthly active users.

So What? Why Should I Care?

Next to using a crystal ball, observing foot traffic patterns is one of the best predictors for seasonal trends.

Get the full results for this deep-dive report on Q4 2019 Foot Traffic Predictions — now available here.


Want more inSights reports? Sign up at go.inmarket.com/subscribe or check out inmarket.com/insights.

To learn how your brand can connect with consumers on key milestone days, contact us today.

Check out our other articles:

Read More

Where Vegetarian-Leaning Consumers Grub & Grocery Shop

July 17, 2019 / by inMarket

In this updated report on Vegetarian-Leaning Consumers, as more consumers increasingly demand healthier alternatives, it’s clear that consumer preferences are evolving quickly with the announcement of Beyond Meat’s IPO and Burger King rolling out Impossible Whoppersnationwide. By analyzing real-time foot traffic patterns from millions of opted-in U.S. consumers, we are able to gain a granular and actionable perspective on changing grocery and QSR/fast casual trends, and guide marketers to connect with relevant audiences as trends shift.

Get the full results for this deep-dive report on Where Vegetarian-Leaning Consumers Grub & Grocery Shop — now available here.

Specialty Grocers Outpace Mainstream Grocers

Specialty grocers like Whole Foods, Trader Joe’s, and Sprouts have outpaced mainstream grocers, likely due to the fact that they offer a much more diverse array of vegetarian options than their mainstream counterparts as demand for meat alternatives increases. These specialty grocers also have historically focused on specialty food items like alternative healthier food items and vegetarian offerings — which makes the top 3 grocery chains appealing to vegetarian-leaning shoppers.

Traditional Grocers Included in Majority of Top Choices

While the top 3 are made up of specialty grocers, a majority of the top 10 also include more traditional grocery chains. While vegetarian-leaning consumers over-index at specialty grocers, mainstream grocers are still appealing to this audience as they have expanded their vegetarian options to stay competitive — the convenience of being able to buy specialty items without taking an extra trip to a specialty grocer is an attractive selling point to consumers.

Top Choices of QSRs/Fast Casual Eateries Test Meatless Options

Little Caesar’s, which sits at #8 on the list, is currently testing the Impossible Supreme pizza which features the animal protein substitute from Impossible Foods, further cementing the trend towards meatless options. Also included are fast food Mexican joints, which is also makes sense considering Del Taco recently released their new meatless menu item, Beyond Tacos.

Pizza Rules Other Food Categories

3 of the top 5 restaurants that meat alternative buyers go to are pizza joints. Pizza chains are most popular among customers who purchase meat alternative products, likely because a plain cheese pizza or a veggie supreme is, of course, vegetarian. MOD Pizza, one of the highest ranking fast casual eateries for vegetarian-leaning customers, also happens to be one of the most-funded, having raised more than $312 million thus far.

Sandwich & Mexican Joints Would Benefit from Introducing Meatless Alternative Items

Interestingly, we have three major sandwich chains and two Mexican food chains that over- index with vegetarian-leaning customers, which makes both categories a likely place for expansion of Impossible products.

How We Did It

inMarket used first-party, SDK-derived location data of over 50 million Comscore-verified active users to first identify vegetarian-leaning consumers based on which meat alternative brands they’ve purchased, then analyzed their visitation patterns to rank the grocers and eateries this group over-indexes.

So What? Why Should I Care?

Next to using a crystal ball, observing foot traffic patterns is one of the best predictors for consumer behavior, grocery, and fast food chain strategy. Measuring these real-time movements is crucial because it provides an extra dimension of observation and early visibility into how new menu offerings might affect the direction in which the QSR/fast casual industry will move.

Get the full results for this deep-dive report on Where Vegetarian-Leaning Consumers Grub & Grocery Shop — now available here.


Want more inSights reports? Sign up at go.inmarket.com/subscribe or check out inmarket.com/insights.

To learn how your brand can connect with consumers on key milestone days, contact us today.

Check out our other articles:

Read More

Top Restaurants and Retail Chains That Will Win Big This Father’s Day

June 13, 2019 / by inMarket


While Mother’s Day is revered as one of the biggest spending days of the year, Father’s Day is a more modest but growing market. Spending on Father’s Day in the U.S. has grown 70% (or $6.6 billion) over the past decade, and shoppers are expected to spend a record high of $16 billion for dads nationwide. As this day for dad increasingly becomes a bigger spending holiday, inMarket’s first-party SDK derived location data has predicted the restaurant and retail chains that will receive the biggest boosts in consumer traffic this Father’s Day.

Get the full results for this deep-dive report on Father’s Day — now available here.

Restaurant Winners


Dads really like their meat. Eight of the top twenty restaurants are comprised of steakhouses and BBQ chains, suggesting that wherever the ribs or steaks are, families will be there as well (be sure to bring wipes).

  • There’s a definite type of ambiance that dads are attracted to on Father’s Day — families are predicted to keep meals casual this year. While all restaurants anticipate a boost in foot traffic due to this holiday, upscale restaurants like Morton’s Steakhouse and The Capital Grille see much smaller increases in foot traffic than casual chains like Texas Roadhouse.
  • Pizza joints like Simple Simon’s Pizza and Anthony’s Coal Fired Pizza see an increase in foot traffic, but are not expected to be a top choiceamongst those celebrating Father’s Day.

Retail Chain Winners

  • Amongst the top ten chains with highest increase in foot traffic, movie theaters are expected to see higher foot traffic. While blockbuster films like Incredibles 2 and Ocean’s 8 caused visitations to spike in 2018, new hits like The Secret Life of Pets 2 and Men in Black: International will also likely drive families into theaters on Father’s Day.
  • Almost half of the top twenty chains, comprised of Outdoor and Sporting Goods chains, are predicted to see higher than average foot traffic. Want to make dad happy this year? Get him a new tackle box or new golf clubs.
  • While two auto chains, Fix Auto Worldwide and Gerber Collision, are included amongst the top 20, they are the exception as a majority of auto chains are expected to see a drop in foot traffic.
  • Surprisingly, while tools and home maintenance are typical “dad” interests, hardware and home improvement chains like The Home Depot and Lowe’s are expected to see a significant decrease during Father’s Day.

How We Did It

inMarket combined years of precise location data and AI to predict the big winners based on their visitation frequency growth on Father’s Day. We first aggregated each location’s average traffic prior to Father’s Day, then observed how much visits increased on Father’s Day, and finally ranked each location by percent of visit growth from highest to lowest.

So What? Why Should I Care?

Next to using a crystal ball, observing foot traffic patterns is one of the best predictors for consumer behaviors and holiday trends.Get the full results for this deep-dive report on Father’s Day — now available here.


Want more inSights reports? Sign up at go.inmarket.com/subscribe or check out inmarket.com/insights.

To learn how your brand can connect with consumers on key milestone days, contact us today.

Check out our other articles:


Read More

How Successful Were Impossible Whoppers in Burger King’s Test Markets?

May 22, 2019 / by inMarket

Credit: Burger King

Burger King made big headlines when it announced it would be testing The Impossible Whopper — featuring an entirely meatless patty created by plant-based food producer, Impossible Foods — in the St. Louis market. Burger King is expanding this menu offering nationwide, so we’ve analyzed visitation patterns to show the impact of the Impossible Whopper’s launch on test markets, and how it may affect this fast food chain nationwide as well.

Get the full results for this deep-dive report on Impossible Whoppers — now available here.

  • Overall, Burger King locations selling the Impossible Whopper outperformed the chain’s U.S. foot traffic average by 18.5% during the test period.
  • During the month of the Impossible Whopper’s release, St. Louis Burger King locations attracted 16.75% higher foot traffic than the previous month’s average.
  • Burger King locations that did not roll out Impossible Whoppers saw a slight decrease in visits. Nationally outside of St. Louis, foot traffic was 1.75% lower during the Impossible Whopper’s test period, compared to the previous month’s average.
  • It’s likely that this massive boost in foot traffic is due in large part to the fast food chain’s new meatless option. Given the success in St. Louis, we expect to see a positive impact on visitation as the Impossible Whopper rolls out nationally in the future.

How We Did It

inMarket’s first-party, SDK-derived location data of over 50 million Comscore-verified active users to analyze visitation spikes and dips for Burger King locations selling the Impossible Whopper in St. Louis and compared it to nationwide Burger King locations who did not sell the Impossible Whopper.

So What? Why Should I Care?

Next to using a crystal ball, observing foot traffic patterns is one of the best predictors for consumer behavior, fast food chain strategy and growth. Measuring these real-time movements is crucial because it provides an extra dimension of observation and early visibility into how new menu offerings might affect the direction in which the fast food industry will move.


Get the full results for this deep-dive report on Impossible Whoppers — now available here.

Want more inSights reports? Sign up at go.inmarket.com/subscribe or check out inmarket.com/insights.

To learn how your brand can connect with consumers on key milestone days, contact us today.

Check out our other articles:

Read More

Subscribe to Email Updates

Recent Posts