inMarket


Recent Posts

Amazon’s Effect on Whole Foods Shopper Behaviors

May 16, 2019 / by inMarket

Since Amazon’s acquisition of Whole Foods in 2017, this natural-leaning grocer has seen numerous changes from the introduction of Amazon Lockers to the addition of Amazon Prime benefits. And as Amazon continues to evolve their strategy for Whole Foods, inMarket has used first-party, SDK derived always-on location data to observe visitation habits, frequency, dwell time, and purchasing trends to help marketers understand Amazon’s impact on this chain.

Get the full results for this deep-dive report on Whole Foods 360-Degree inSights— now available here.

Foot Traffic

Whole Foods brought in higher foot traffic in Q1 2019 than compared to the same time period last year. Amazon seems to be focused on inspiring visits from their customers by incentivizing their 100 million Prime membership holders with special perks and doubling down on their digital omnichannel strategy. This may also indicate that shoppers are visiting more frequently than the previous year.

New Shoppers

The number of new shoppers at Whole Foods has decreased from Q1 2018. While 2018 was a strong year for bringing in new shoppers, Whole Foods has slowed down on this strategy, and is instead focusing on developing plans to retain current shoppers.

Micro Visits

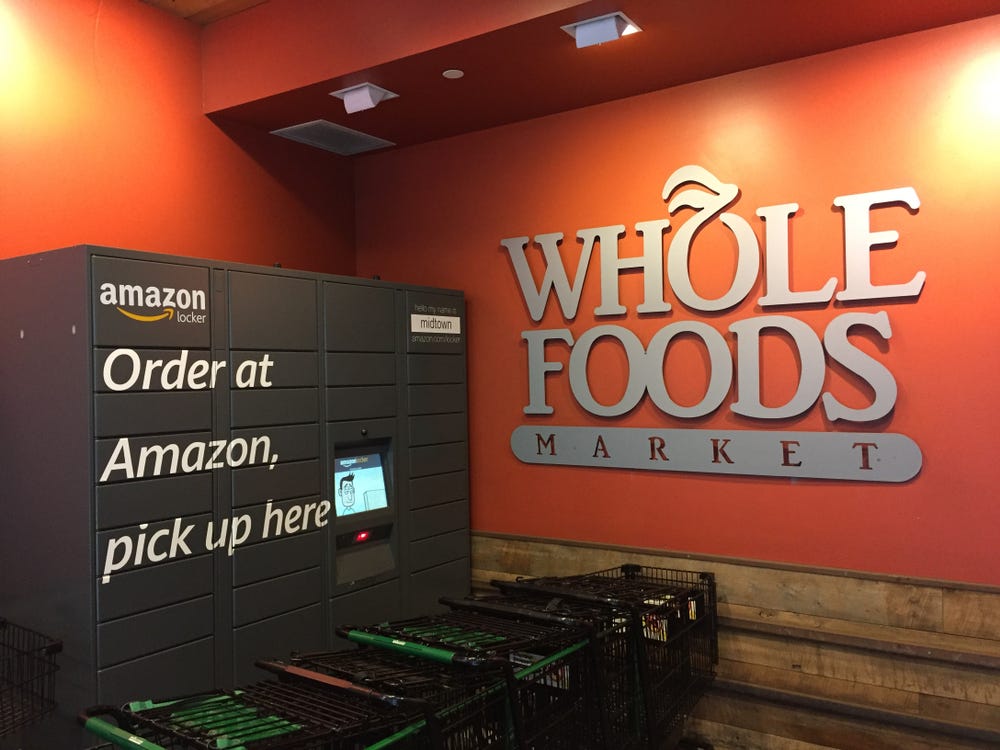
There was a substantial increase in micro visits in 2019, which may be due to the increased rate of additional Amazon Lockers and streamlined online order pickups for quick in-and-out trips.

Dwell Time

Shoppers who enter Whole Foods locations are spending less time there. This may be a small byproduct of the increased micro visits on average dwell time — shoppers who are just above the 5 minute threshold for micro visits might be affecting the average dwell time.

Brand Volume Growth

Interestingly, brands for pantry or dry packaged foods — like granola bars or cereal — were not among the top 5. Whole Foods shoppers are buying brands which largely focus on perishable and/or refrigerated items — confirming that consumers demand a fresh, healthy selection of food.

How We Did It

inMarket’s first-party, SDK derived location insights platform measured foot traffic spikes and dips around key days for non-grocery retailers using 50 million Comscore-verified monthly active users.

So What? Why Should I Care?

Next to using a crystal ball, observing foot traffic patterns is one of the best predictors for consumer behavior, grocery chain strategy and growth. Measuring these real-time movements is crucial because it provides an extra dimension of observation and visibility into Amazon’s master plan, and predicts the direction in which the grocery industry will move.


Get the full results for this deep-dive report on Whole Foods — now available here.
Want more inSights reports? Sign up at go.inmarket.com/subscribe or check out inmarket.com/insights.

To learn how your brand can connect with consumers on key milestone days, contact us today.

Check out our other articles:

Read More

inMarket Predicts the Big Winners on Mother’s Day

May 9, 2019 / by inMarket

Photo by Chema Photo on Unsplash

Everyone loves mom — and it’s not just because moms are awesome (they do make the best home cooked dinners or know how to cheer you up when you’re down). Mother’s Day is one of the biggest spending days of the year, and that means huge opportunities for brands to drive revenue.

inMarket has analyzed multiple years of our SDK derived, always-on, precise location data with advanced AI algorithms in order to predict the big winners in visitation increase this Mothers Day.

Get the full results for this deep-dive report on Mother’s Day — now available here.
Restaurant Winners


Upscale restaurants are expected to see higher foot traffic on Mother’s Day.

  • The top 4 group includes upscale restaurants, as families will likely show their appreciation for mom by wining and dining her at a fancy restaurant.
  • Kona Grill, which filed for bankruptcy in April 2019, is among the top 5 restaurants to see foot traffic higher than its typical average. Mothers Day is expected to provide this restaurant a much needed boost.
  • Several well known casual dining chains are predicted to be popular as well, suggesting that a more relaxed, kid-friendly environment appeals to other families.
  • While restaurants are predicted to be popular, ice cream chains like Ben & Jerry’s and Carvel are also expected to see higher than normal traffic. Whether after an upscale steak dinner, or a belt-loosening buffet, Mothers Day celebrators will always leave room for dessert.
  • Interestingly, although Mothers Day is widely known as a brunch or breakfast holiday, chains like Denny’s (-8.31%) or Waffle House (-10.78%) are expected to see lower foot traffic.

Retail Chain Winners


Mother’s day isn’t just for mom when it comes to retail.

  • Although foot traffic increases significantly at obvious “mom” retailers (like Ann Taylor), there are also increases for several children’s and teen-centric chains (like LEGO and Hollister) as well. Mothers Day isn’t just about mom — in this case, it’s about the family. Mothers Day is a reason for families to get together, and the data predicts that families will browse stores together.
  • Many chains that see lower than average foot traffic are places moms traditionally need to go: non-luxury Household Goods chains like Bed Bath & Beyond (-6.57%) and craft stores like Michaels (-8.05%) will see a drop on this holiday. These chains are frequent “mom” destinations, so families take her elsewhere on Mothers Day.

How We Did It

inMarket combined years of precise location data and AI to predict the big winners based on their visitation frequency growth on Mother’s Day. We first aggregated each location or category’s average traffic prior to Mother’s Day, then observed how much visits increased on Mother’s Day, and finally ranked each location by percent of visit growth from highest to lowest.

So What? Why Should I Care?

Next to using a crystal ball, observing foot traffic patterns is one of the best predictors for trends.

Get the full results for this deep-dive report on Mother’s Day — now available here.
Want more inSights reports? Sign up at go.inmarket.com/subscribe or check out inmarket.com/insights.


To learn how your brand can connect with consumers on key milestone days, contact us today.

Check out our other articles:

Read More

Key Days to Market in the Summer

April 22, 2019 / by inMarket

We get it — summer can sometimes be slow for retailers that focus heavily on the winter holidays. For those stuck in the summer slump, we uncovered key dates that are being underutilized to help brands connect with consumers. Take a look!

Slurpee Day


Mmmm, taste that sweet refuge from the summer heat.Who doesn’t love a frosty cold treat for FREE on a hot summer day? Slurpee Day, celebrated every year on July 11th (7/11), is also the 2nd busiest time during the summer months for convenience stores. This unofficial holiday may be the reason people are rushing into convenience stores while other retail categories were down. Brands have a unique opportunity to reach consumers at C-stores this year on Thursday, 7/11/2019.

Lunar & Solar Eclipses


2018 was a big year for astrological events:

Lunar Eclipse

  • Higher foot traffic than usual across all categories except drug stores
  • Notably higher than average foot traffic at convenience store

Solar Eclipse

  • Higher than usual foot traffic across all categories except drug stores
  • 2nd busiest day for department stores

Astrological milestones are a unique and underutilized opportunity for marketers to connect with consumers as they gear up to observe the heavens. Plan around the upcoming lunar eclipse on 7/16/2019. Marketers will unfortunately have to wait until 2024 for the next visible solar eclipse in the U.S.

NOT Labor Day


Labor Day is an obvious date for marketers to note in their calendars, but the day of the actual holiday sees a significant drop in foot traffic. Department stores are busiest on the Saturday during the long weekend before the actual holiday, so marketers should focus on advertising on the days leading up as consumers are shopping early and relaxing the day of Labor Day.

How We Did It

inMarket’s first-party, SDK derived location insights platform measured foot traffic spikes and dips around key days for non-grocery retailers using 50 million Comscore-verified monthly active users.

So What? Why Should I Care?

Next to using a crystal ball, observing foot traffic patterns is one of the best predictors for seasonal trends.

Get the full results for this deep-dive report on Q3 2019 Foot Traffic — now available here.


Want more inSights reports? Sign up at go.inmarket.com/subscribe or check out inmarket.com/insights.

To learn how your brand can connect with consumers on key milestone days, contact us today.

Check out our other articles:

Read More

When You Should Advertise During Spring 2019

April 4, 2019 / by inMarket

Spring is finally here — and the thaw means more reason to leave the house and enjoy the warm weather outside. inMarket analyzed retail visitation and purchase patterns to reveal consumer behaviors from April to June.

Through the lens of our massive historical data sets, inMarket has identified the most important shopping dates based on the heaviest foot traffic in each retail category. From these insights, many brands have key opportunities to initiate conversations that engage shoppers and drive huge ROI.

Get the full results for this deep-dive report on Q2 2019 Foot Traffic — now available here.

Dads Need More Love

Sorry dads, but Mother’s Day is a bigger shopping day than Father’s Day across all categories. However, both parental holidays are among the busiest 3 shopping days for department stores and among the top 2 shopping days for big box chains during the spring.

Spring is in Full Swing

Spring means warm weather, new growth, outdoor events, concerts, and more. With the thaw in full effect, folks are finding more reasons to get outside. Weekends before or the days during large outdoor events have higher foot traffic across all categories.

Ah-CHOOse Drug Stores

Hay fever season, which typically starts at the tail end of March, was delayed until mid-April due to a colder than average winter. Drug store visitation is higher than the previous quarter — this is an excellent time for connecting with consumers via mobile about allergy-relief products as they enter drugs store chains.

Cinco de Mayo

All categories see a brief spike in foot traffic right before or on the day of Cinco de Mayo. However, convenience stores were the most popular category during this fiesta.

Memorial Day

All categories, except drug stores, saw an increase in foot traffic before Memorial Day, but a decrease during the holiday itself. This shows planning for this holiday is prevalent throughout the country, and that the weekend of the holiday is spent doing other recreational activities besides shopping.

Convenience is King in the Spring

While department stores typically see similar foot traffic as convenience stores in the winter, convenience stores outperform other categories in the spring.

How We Did It

inMarket’s first-party, SDK derived location insights platform measured foot traffic spikes and dips around key days for non-grocery retailers using 50 million Comscore-verified monthly active users.

So What? Why Should I Care?

Next to using a crystal ball, observing foot traffic patterns is one of the best predictors for seasonal trends.

Get the full results for this deep-dive report on Q2 2019 Foot Traffic — now available here.


Want more inSights reports? Sign up at go.inmarket.com/subscribe or check out inmarket.com/insights.

To learn how your brand can connect with consumers on key milestone days, contact us today.

Check out our other articles:

Read More

Top 25 Grocery Chains with the Highest Loyalty

February 6, 2019 / by inMarket


Grocery chains are hungry to increase shopper loyalty, as it’s a key factor in improving the health of their businesses. While a grocery chain can claim it reigns as the most popular kid on the block, inMarket’s location data with over 50 million comScore verified users prove who really has the most loyal customer base:

Our Findings

  • The number of total stores doesn’t necessarily equate to an increase in shopper loyalty.
  • Grocery chains in urban areas (like Los Angeles) tend to have higher loyalty than their rural competitors (like the Midwest). Geographic areas with denser populations typically attract a higher number of grocery stores clustered together. As a result, this may incentivize customers to take more frequent trips to pick up their meal essentials. On the other hand, rural areas may have fewer grocery stores available and would be a bit more of a trek for shoppers, resulting in fewer repeat trips a month.
  • Customer loyalty index is a barometer that to determine the health of businesses, and helps us understand who’s thriving and who’s not.Repeat customer trends can often predict if businesses will continue to grow or slow.
  • Grocery chains tend to have higher customer loyalty than their retail counterparts. Out of necessity, people typically purchase food more than retail products.

How We Did It

inMarket’s first-party, SDK derived location insights platform accurately profiled, then ranked, the top 25 grocery chains with the highest customer loyalty index using 50 million comScore-verified monthly active users.

So What? Why Should I Care?

Next to using a crystal ball, observing foot traffic trends and analyzing customer loyalty data is one of the best barometers for measuring the health of a grocery chain’s business.


Get the full results for this deep-dive report on the top 25 grocery chains with loyal customers — now available here.

Want more inSights reports? Sign up at go.inmarket.com/subscribe or check out inmarket.com/insights.

To learn how your grocery chain can increase shopper loyalty, contact us today.

Check out our other articles:

Read More

Subscribe to Email Updates

Recent Posts