

Marketing Industry Predictions:
It’s hard to believe the new year is nearly upon us. To get a better understanding of what opportunities and challenges marketers are thinking about this time of year, we asked our clients to share their 2022 marketing landscape predictions.
Download the report to learn more! |
Download The Report Below! × |
|---|
Marketing Industry Predictions:
As marketers prepared for the biggest shopping season of the year, we asked our clients to share their 2021 holiday season predictions. We’ve pulled together the most common themes, plus some quotes, to help you understand what topics are top-of-mind for your peers. Download the report to learn more! |
Download The Report Below! × |
|---|
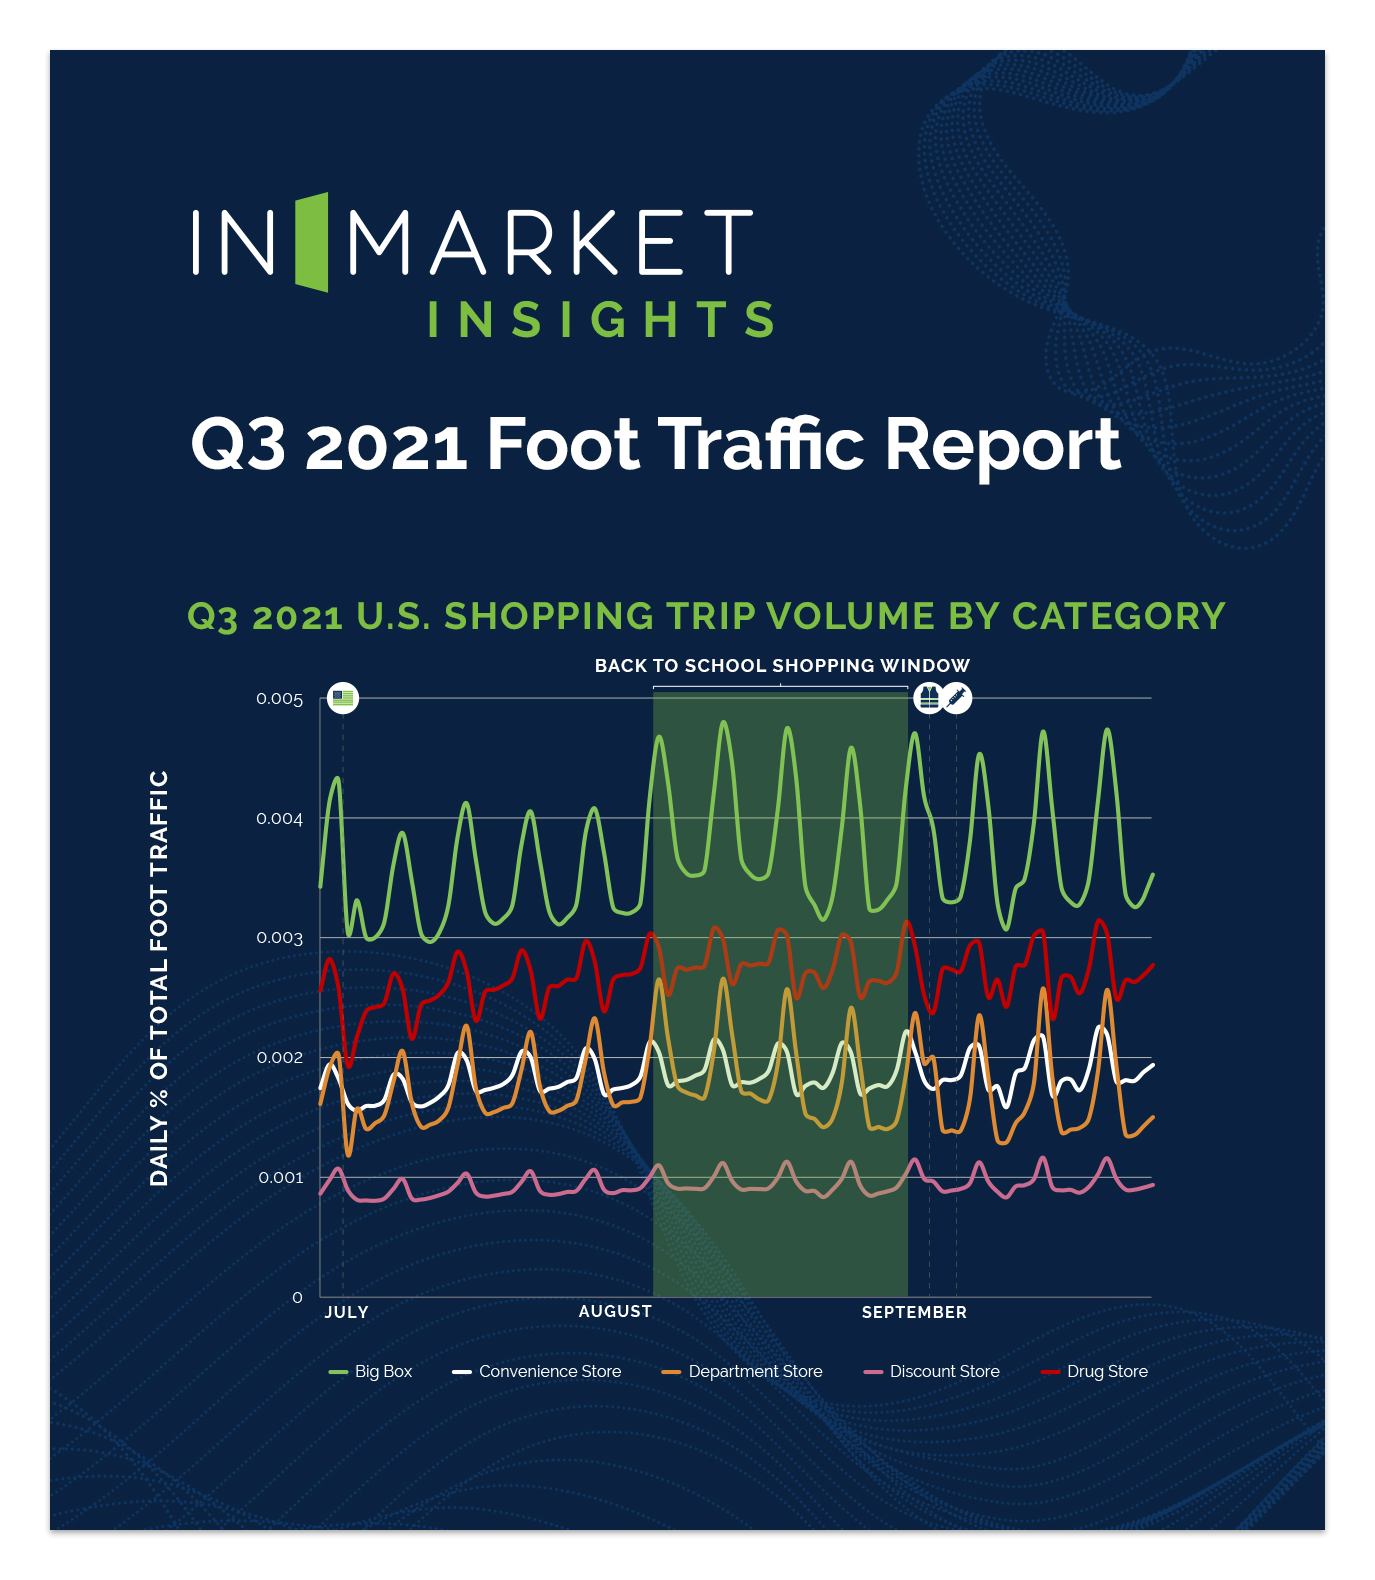
2021 Q3 Foot Traffic Report
InMarket’s Q3 2021 Foot Traffic InSights tracked the foot traffic recovery of 5 key categories throughout the summer months. The back-to-school shopping period in particular saw real-time increases in consumer visit volume across all categories in response to the CDC’s revised recommendations for in-person learning and booster shots, child tax credits, and brand/retail promotions. Download the report to learn more! |
Download The Report Below! × |
|---|
2022 Digital Marketing Playbook
With a new year upon us, now is the time to set yourself up for success. InMarket's 2022 Digital Marketing Playbook outlines 10 key marketing strategies to embrace in order to drive growth in the new year and beyond. Download the report to learn more! |
Download The Report Below! × |
|---|
Q3 2021 Whole Foods InSights
At InMarket, we have routinely analyzed how visits at Whole Foods Market have changed year over year. By observing the impacts of offline foot traffic at this Amazon-owned brick and mortar grocery store, we can better comprehend how consumer shopping preferences, behaviors, and intentions have evolved, and more effectively serve their needs in real time. Download the report to learn more! |
Download The Report Below! × |
|---|
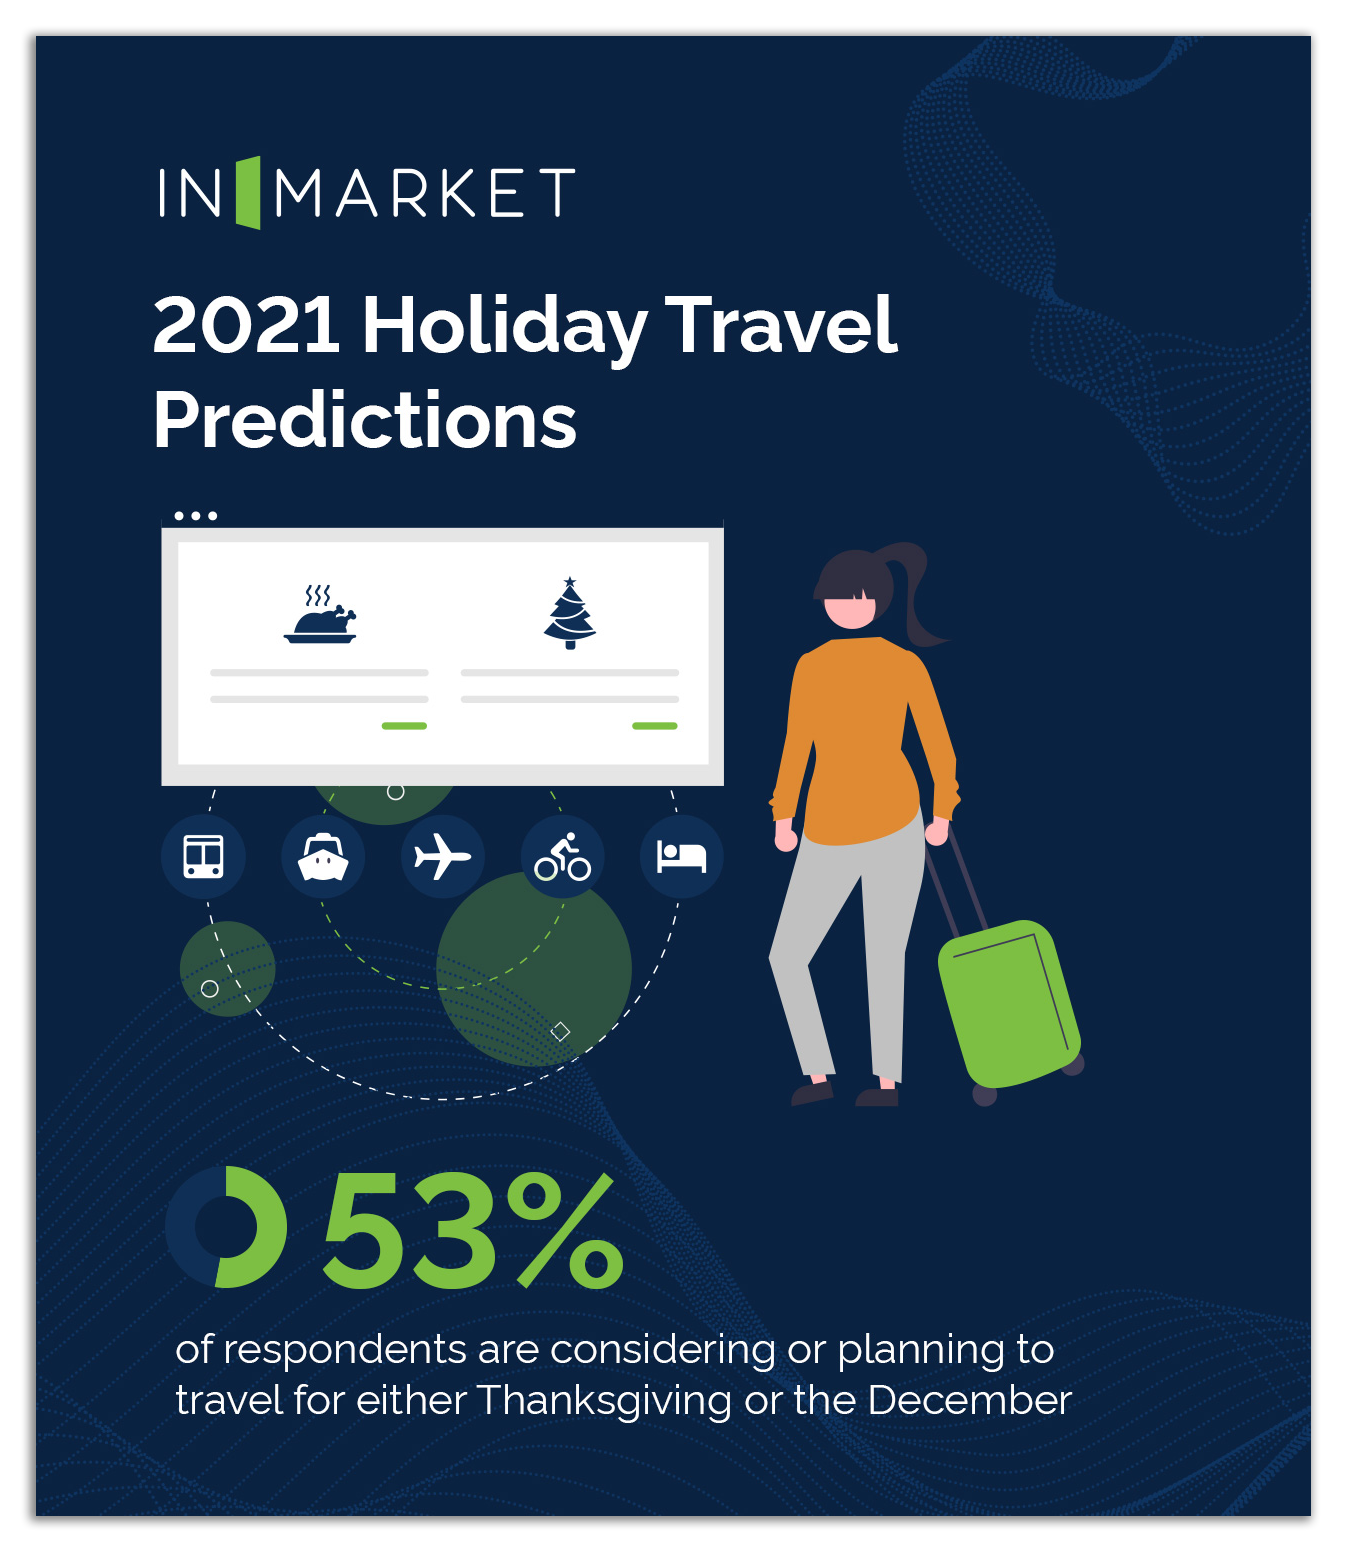
2021 Holiday Travel InSights
InMarket’s 2021 Holiday Travel Predictions cover the biggest consumer travel trends expected to emerge during Thanksgiving and the December holidays. Our report covers travel plans for 2021, the most popular modes of transportation, how behaviors have changed among travelers from 2020, and top recommendations to capture these consumers. Download the report to learn more! |
Download The Report Below! × |
|---|
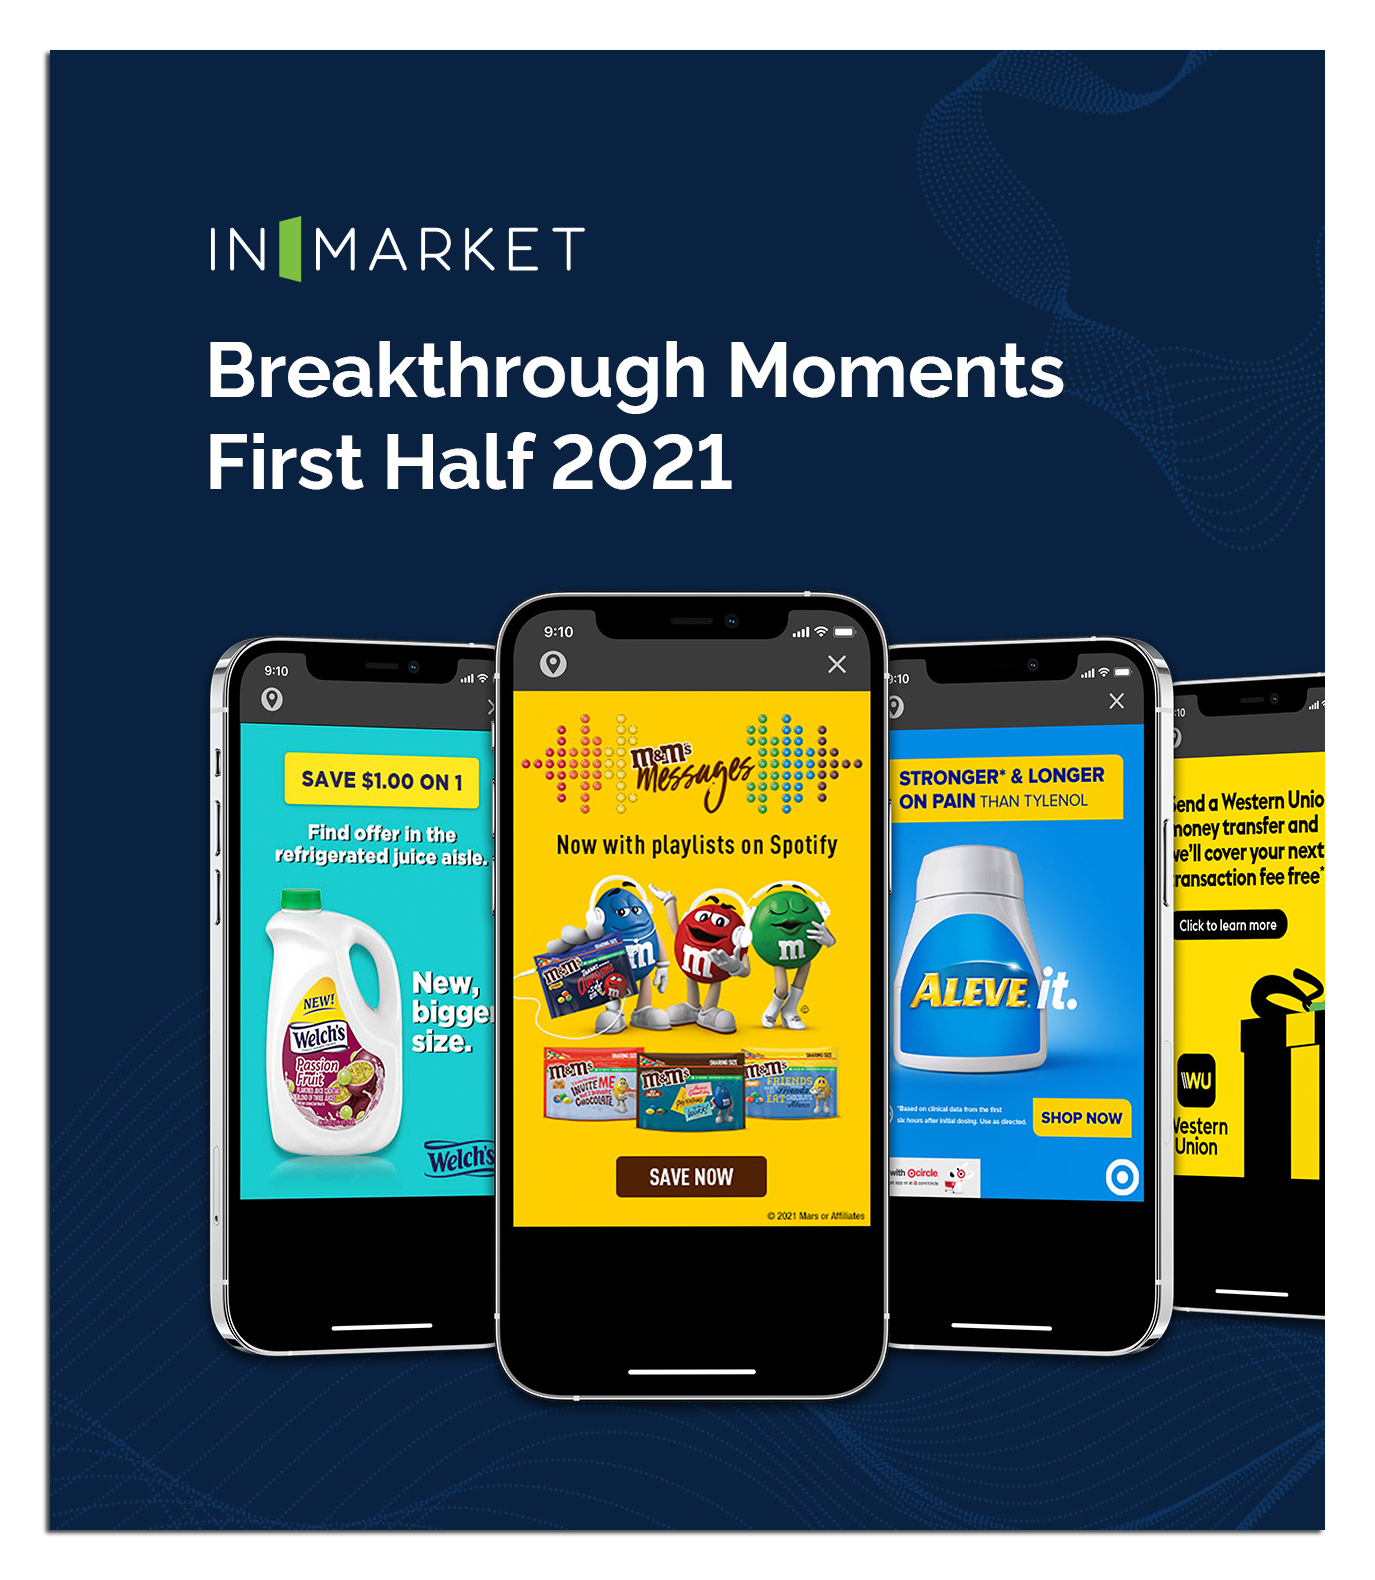
Breakthrough Moments First Half 2021
IAfter a tumultuous 2020, many marketers evolved from survival mode to “the new normal.” Several brands not only adapted to new shopping behaviors and needs shaped by COVID-19, but thrived by connecting and appealing to consumers. As such, InMarket has identified four exceptional marketing campaigns that stood out amongst the crowd during the first half of 2021, delivering Breakthrough Moments that drove off-the-chart consumer engagement and real-world action. Download the report to learn more! |
Download The Report Below! × |
|---|
InMarket InSights Real-Time Sense
In this playbook, you’ll find the 4 steps to adopting real-time, sense and respond marketing so that your brand can understand consumer needs and respond in real time, in the moments that matter. Download the report to learn more! |
Download The Report Below! × |
|---|
InMarket InSights 2021 Holiday Playbook
InMarket’s 2021 Holiday Playbook has 7 seasonal strategies designed to set you up for success in the coming months—from Thanksgiving to New Years, we’ve got everything you need neatly wrapped up in a bow.
Download the report to learn more! |
Download The Report Below! × |
|---|
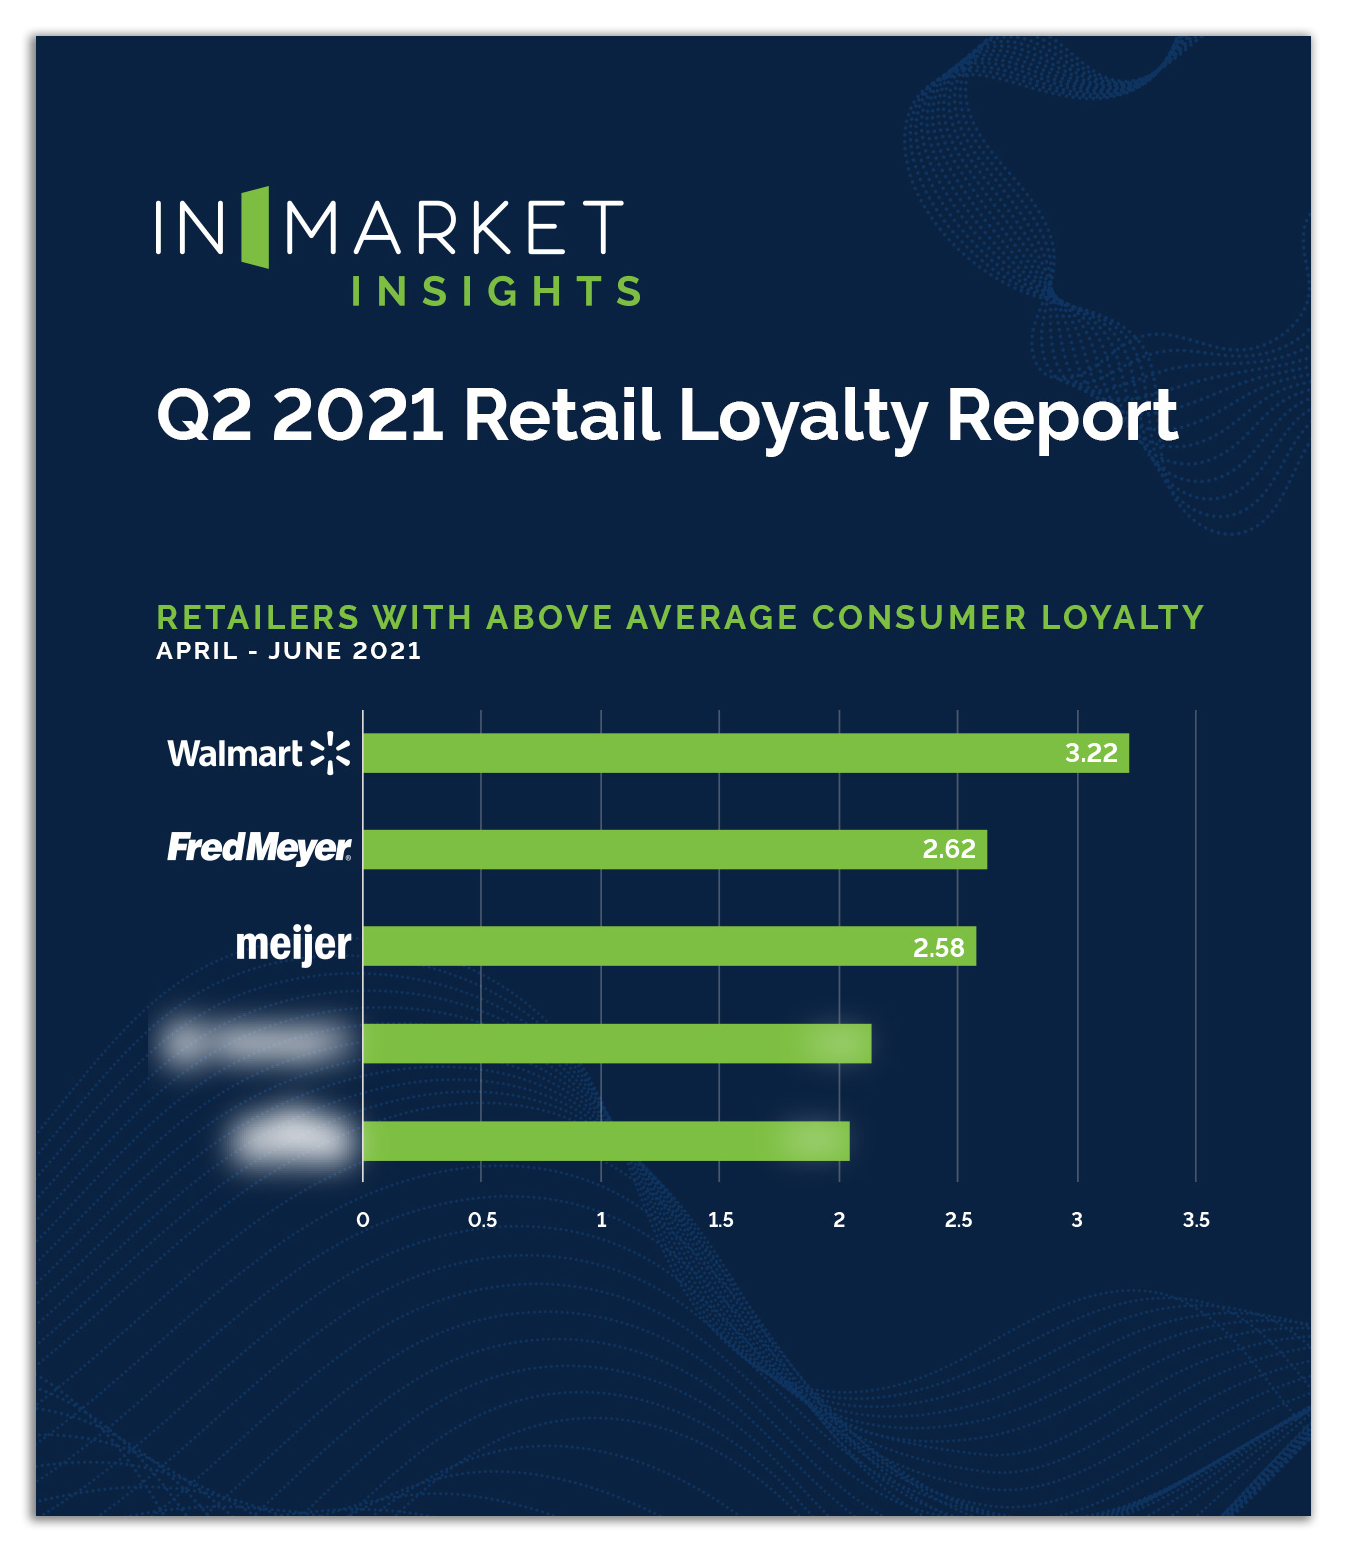
InMarket InSights Q2 2021 Retail Loyalty
InMarket’s Q2 2021 Retail Loyalty Report contains high-level detail and key learnings as to which factors may have contributed to an increase or decrease in consumer loyalty, and how these factors can affect your business as well. Download the report to learn more! |
Download The Report Below! × |
|---|
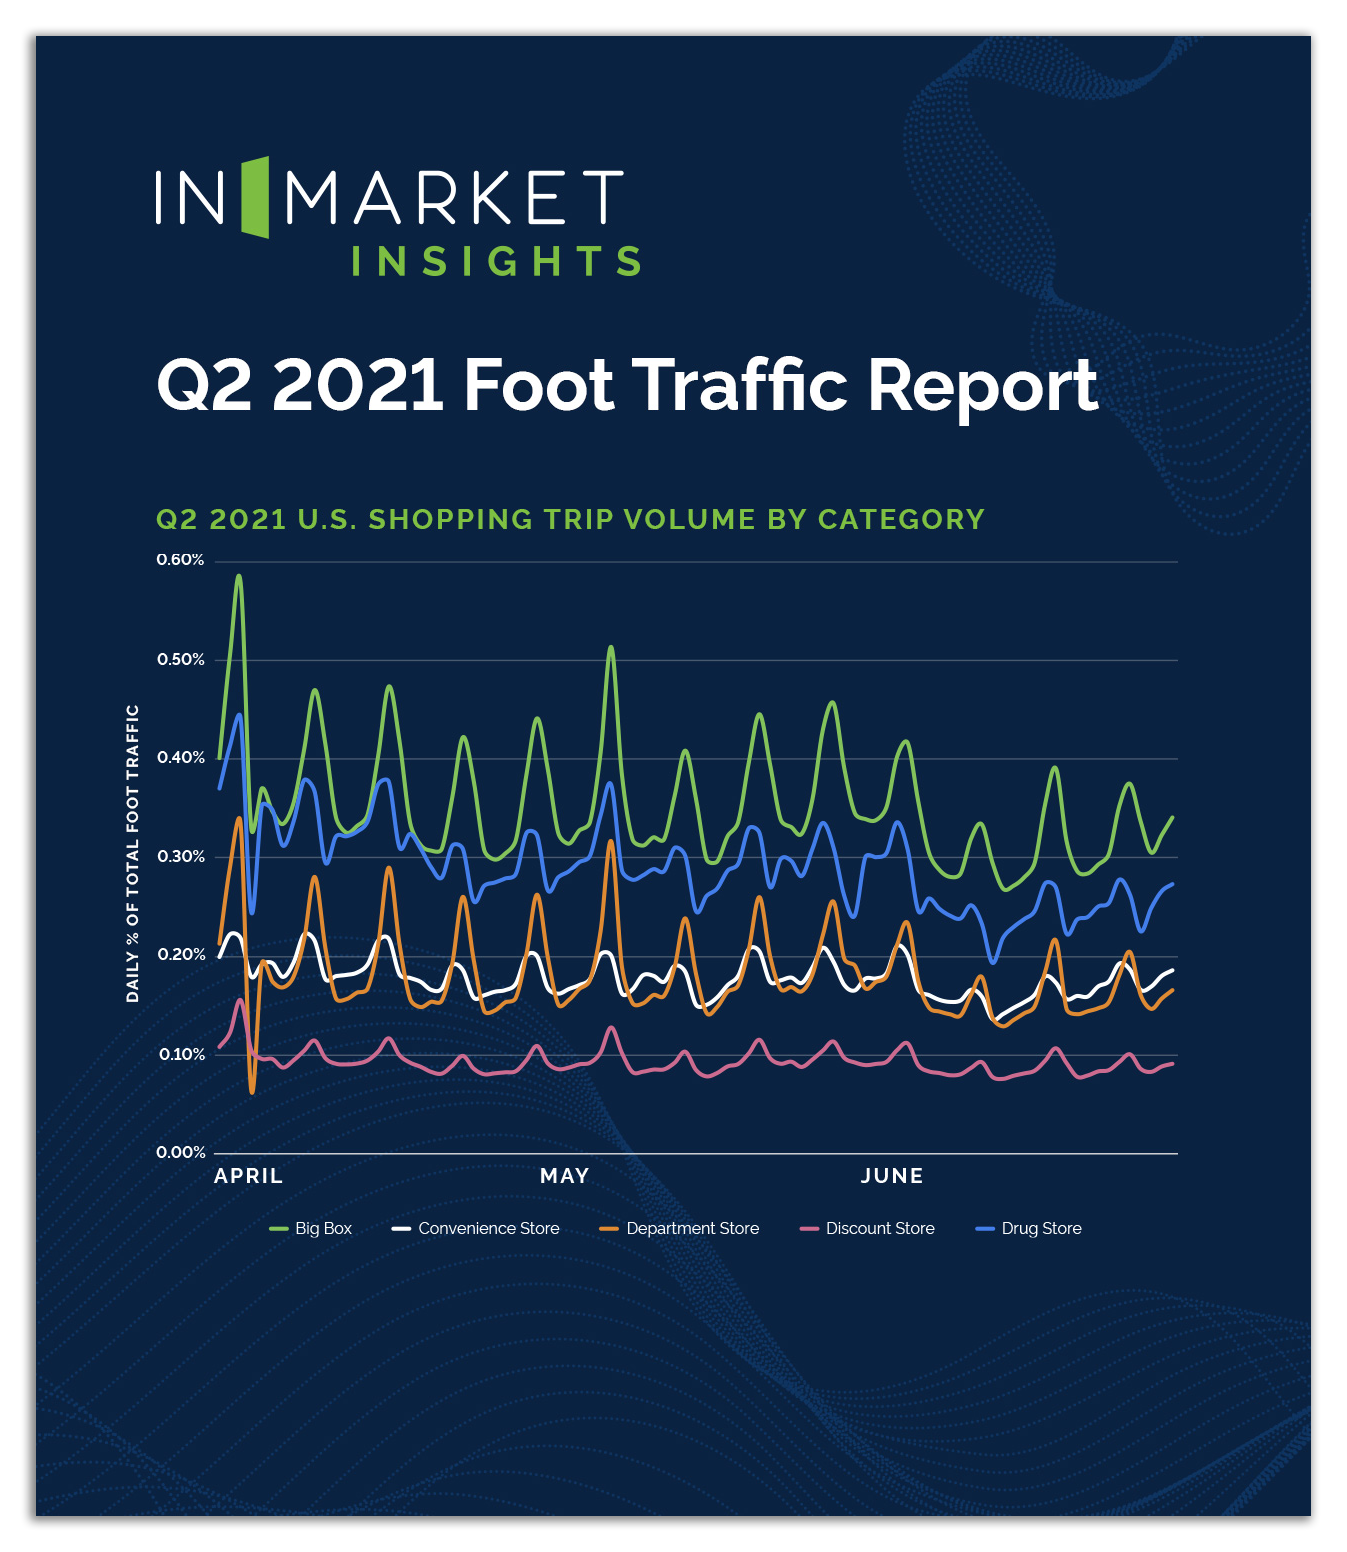
InMarket InSights Q2 2021 Foot Traffic
While the US has more or less fully reopened, the Delta variant has introduced another variable to foot traffic recovery. InMarket’s Q2 2021 Foot Traffic report analyzes consumer visits to Big Box, Convenience, Drug, Department, and Discount Stores to understand how shopper behaviors in the real world are evolving, and to monitor how the latest Covid-19 developments impact consumer trends. Download the report to learn more! |
Download The Report Below! × |
|---|
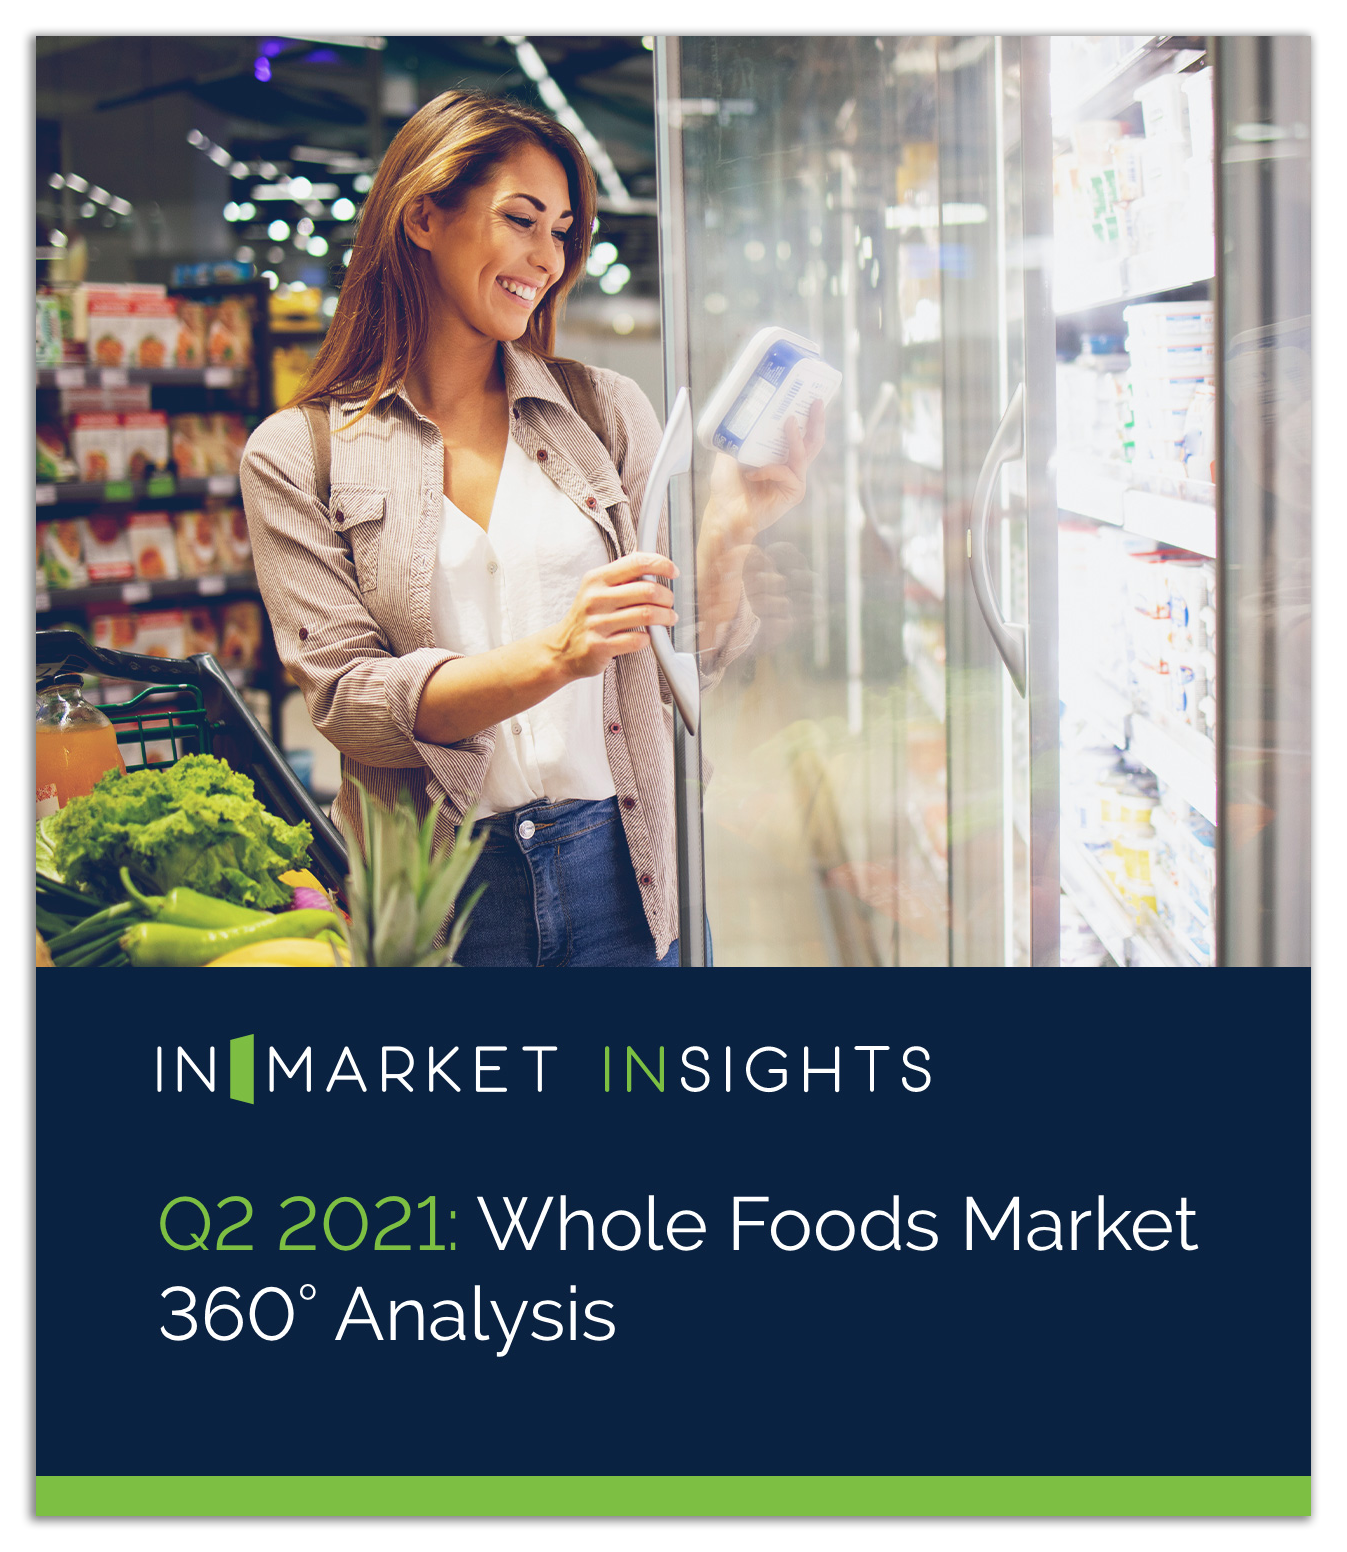
InMarket InSights Whole Foods Q2 2021
Whole Foods Market has seen a massive uptick in micro visits (1-5 minutes). The organic grocer saw a 23% increase in micro visit shoppers, and a 56% increase in micro visits Q2 YOY—strongly indicating that this organic grocer’s strong omnichannel offerings such as curbside pickup and BOPIS (buy online, pickup in-store) are drawing in shoppers even after post-vaccine reopenings. Download the report to learn more! |
Download The Report Below! × |
|---|
InMarket InSights Back-to-School 2021
As more students prepare for in-person schooling this fall, InMarket’s 2021 Back-to-School InSights Report delves into consumer sentiments and shopping habits as states continue to fully reopen. InMarket surveyed US-based consumers and analyzed visit and purchase data to help inform marketers’ strategies and prepare for the upcoming shopping season. Download the report to learn more! |
Download The Report Below! × |
|---|
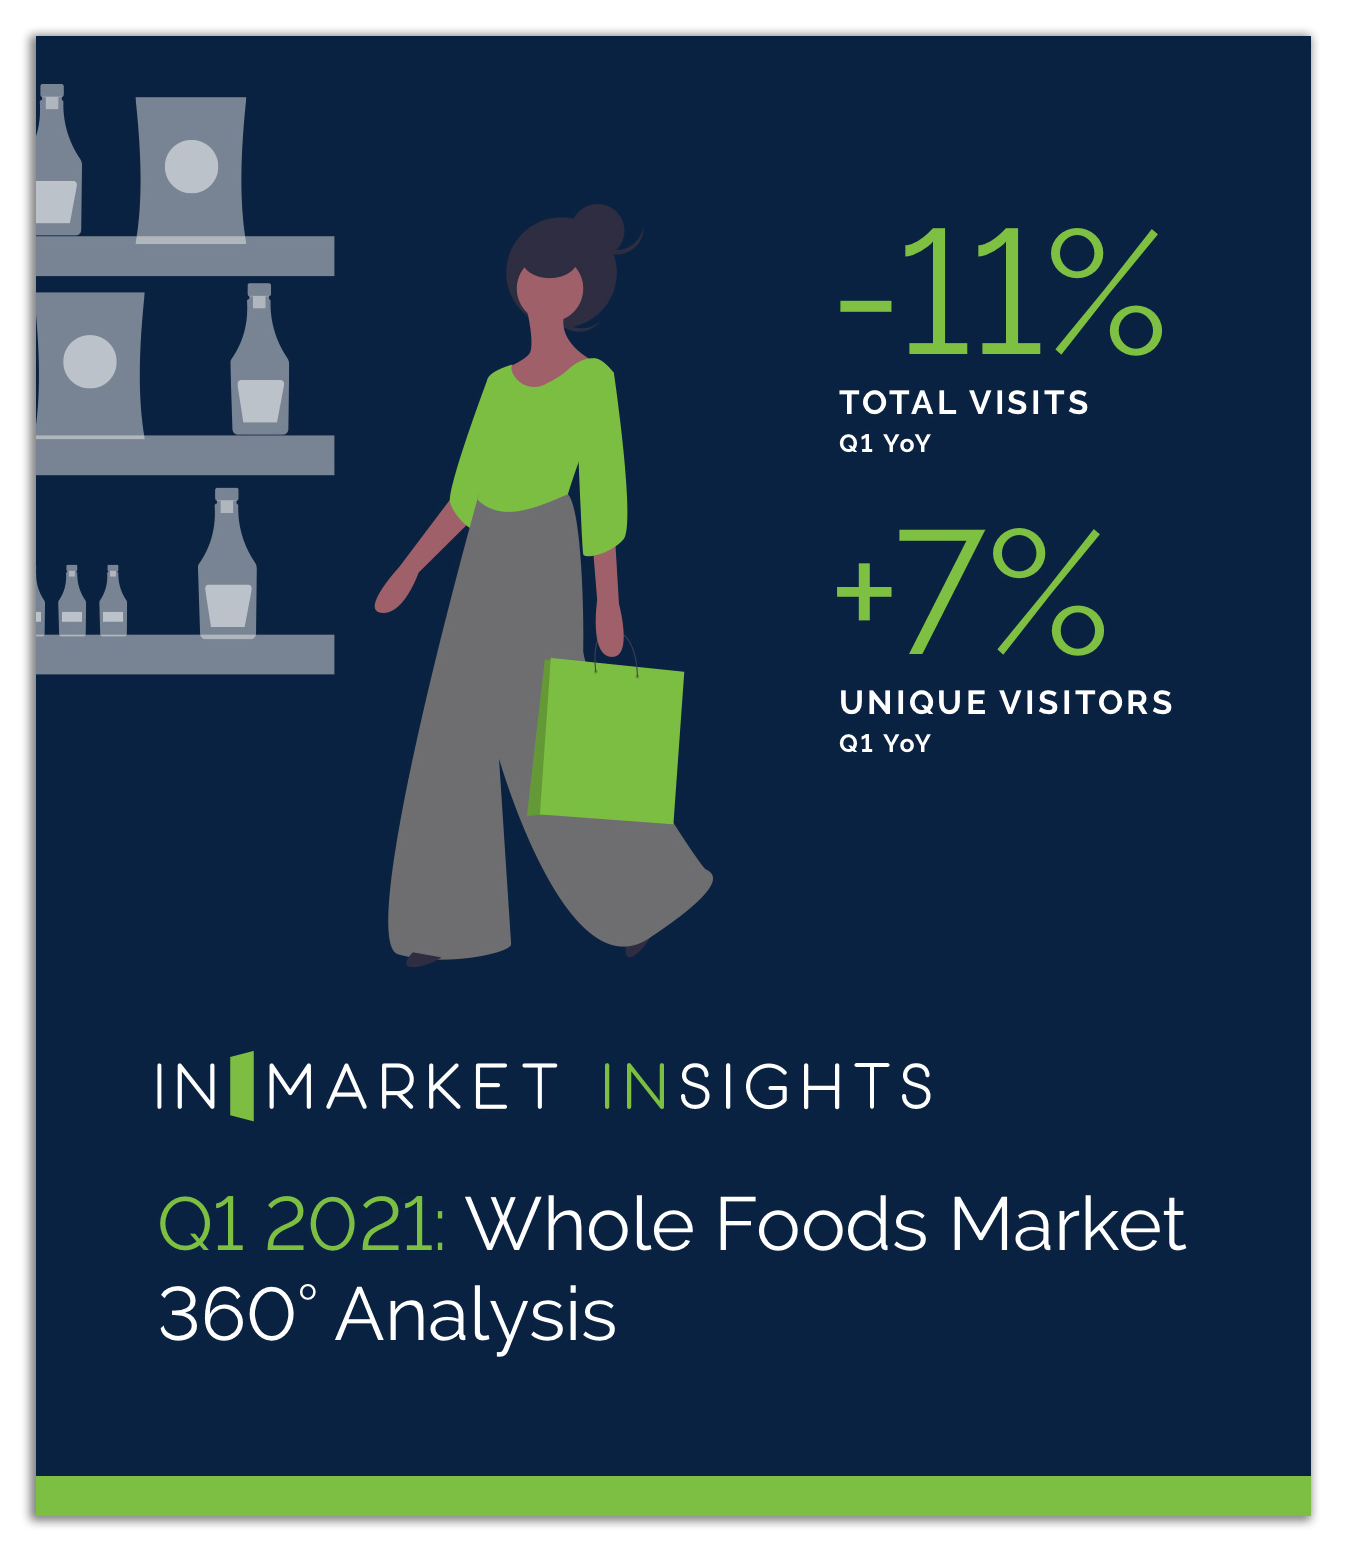
InMarket InSights Q1 Whole Foods Market
According to InMarket data, foot traffic to Whole Foods Market declined in Q1 2021, continuing the year-over-year trend of decreased visitation for the Amazon-owned grocer. Despite weak in-store performance (Amazon’s physical store sales declined by 16% in Q1) in May Whole Foods Market announced a corporate restructuring and the planned opening of 43 additional Whole Foods Market locations across the country, signaling a renewed confidence in the future success of the brand. Download the report to learn more! |
Download The Report Below! × |
|---|
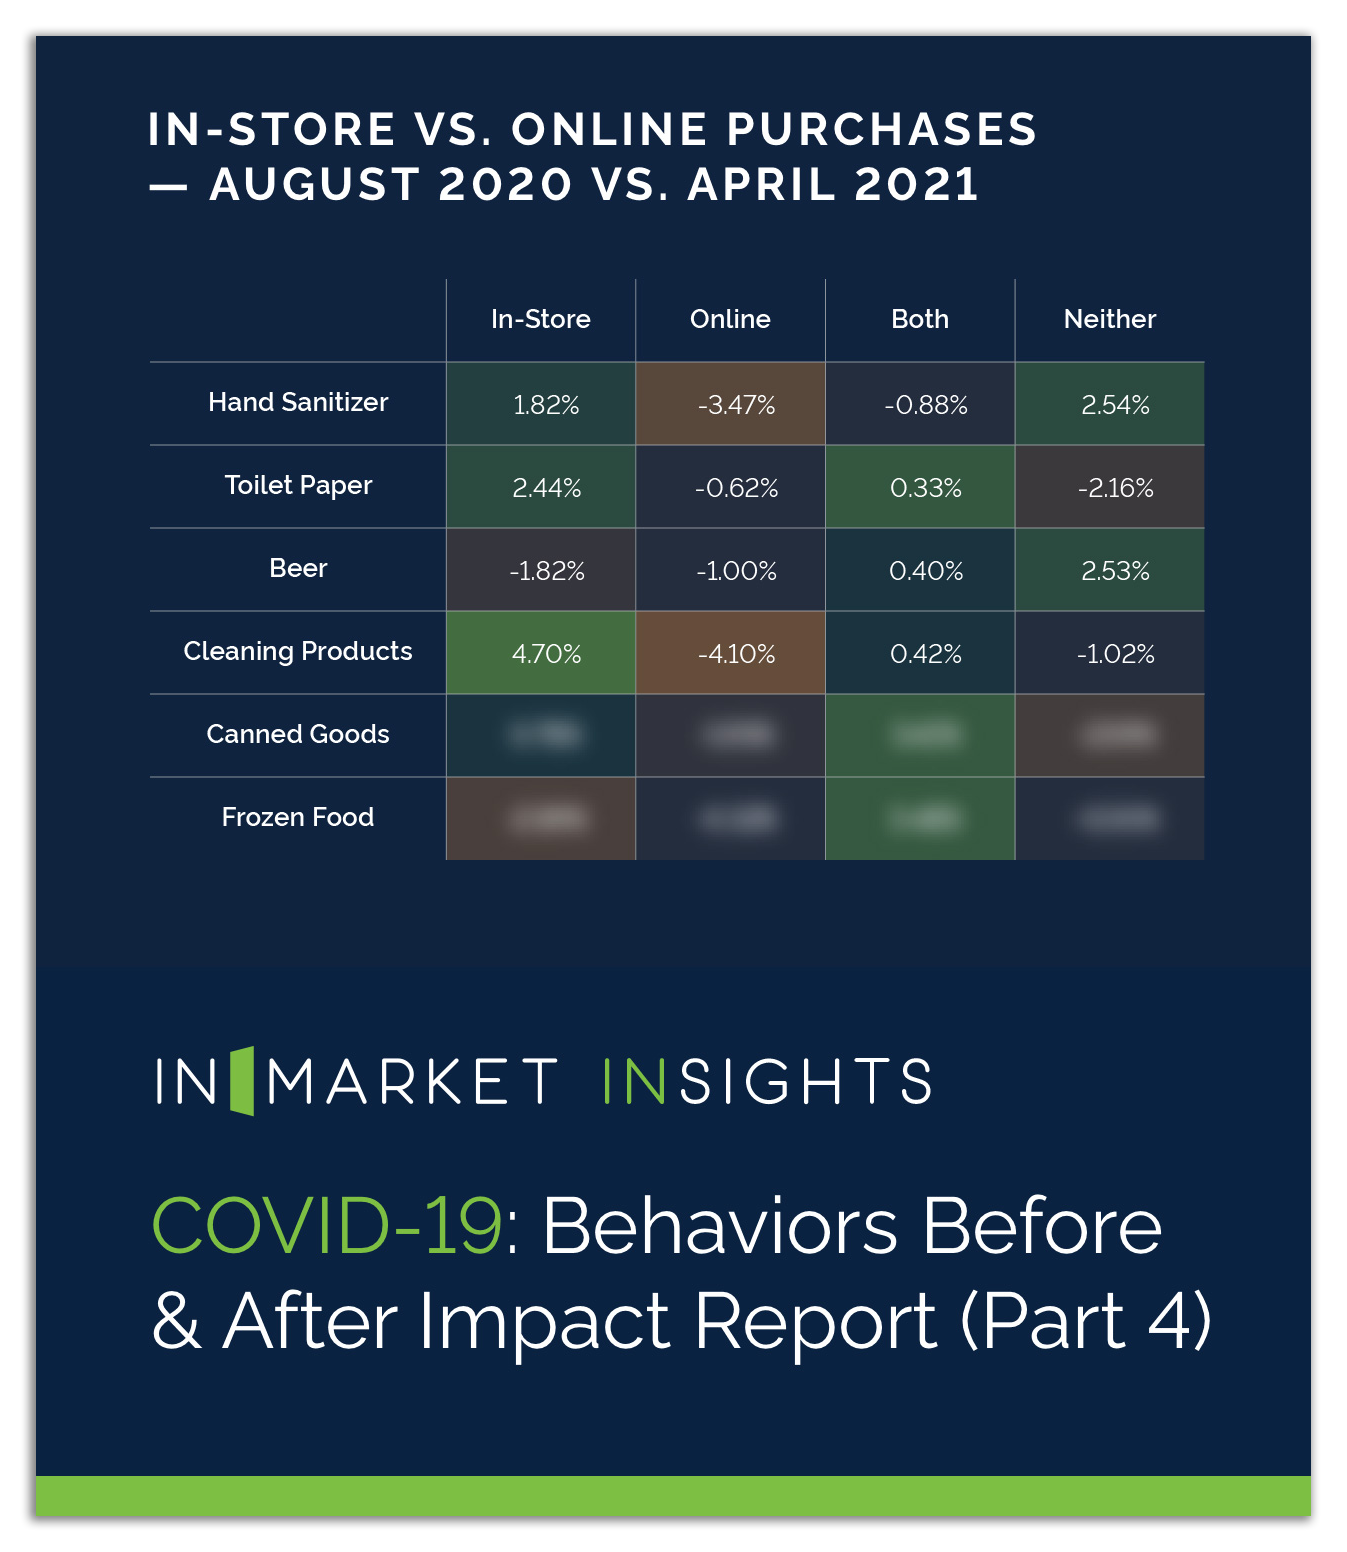
InMarket InSights Covid-19 Behaviors Before
InMarket’s COVID-19 Behaviors Before and After Report explores changing consumer sentiments and shopping habits in response to the COVID-19 vaccine rollout. InMarket surveyed US based consumers during April 2021 to analyze how consumer feelings and perceptions about in-person shopping, where they shop, and what they buy have evolved since the previous survey in August 2020. Download the report to learn more! |
Download The Report Below! × |
|---|
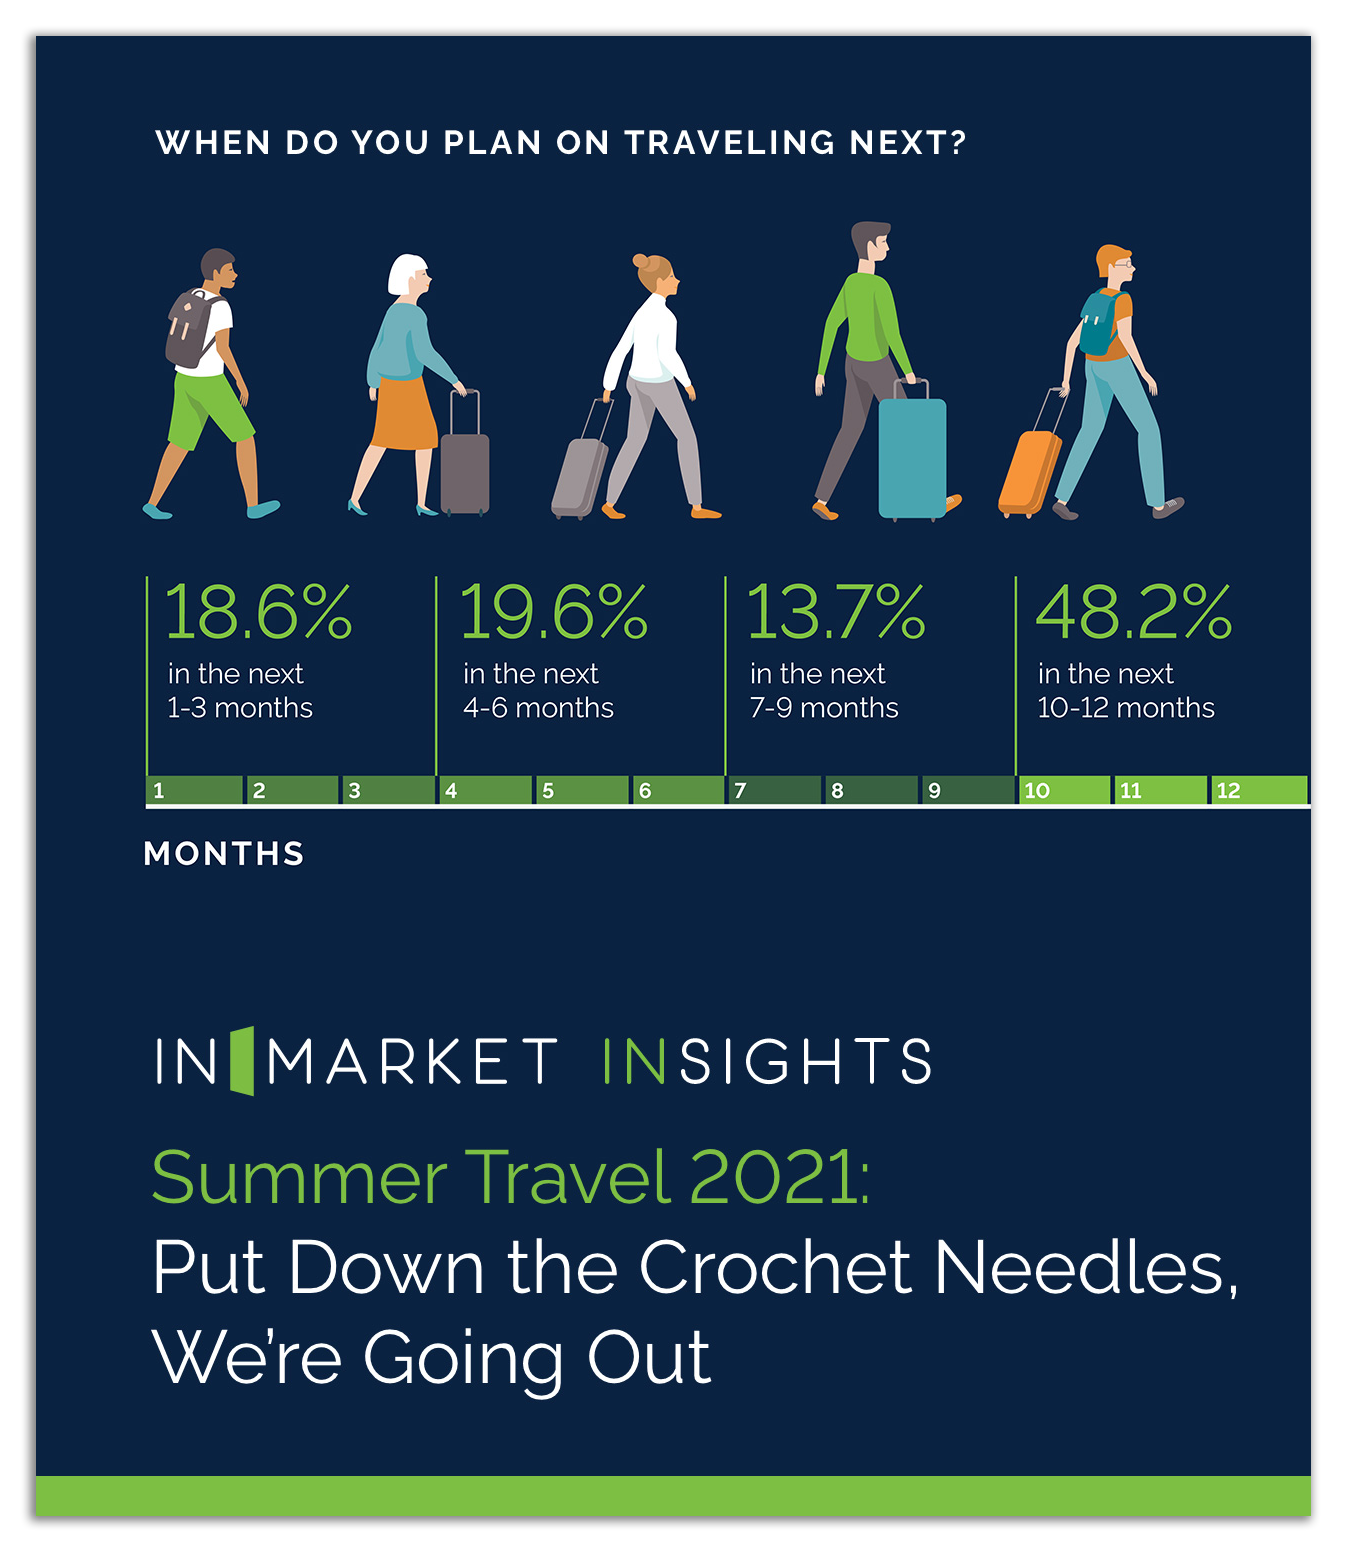
InMarket InSights Summer Travel 2021 Insights Report
InMarket’s Summer Travel 2021 InSights Report has analyzed both visit and survey data to gauge foot traffic trends in real time, and determine consumer travel intent to guide marketers on the best ways to properly position themselves during this period of transition and beyond. Download the report to learn more! |
Download The Report Below! × |
|---|
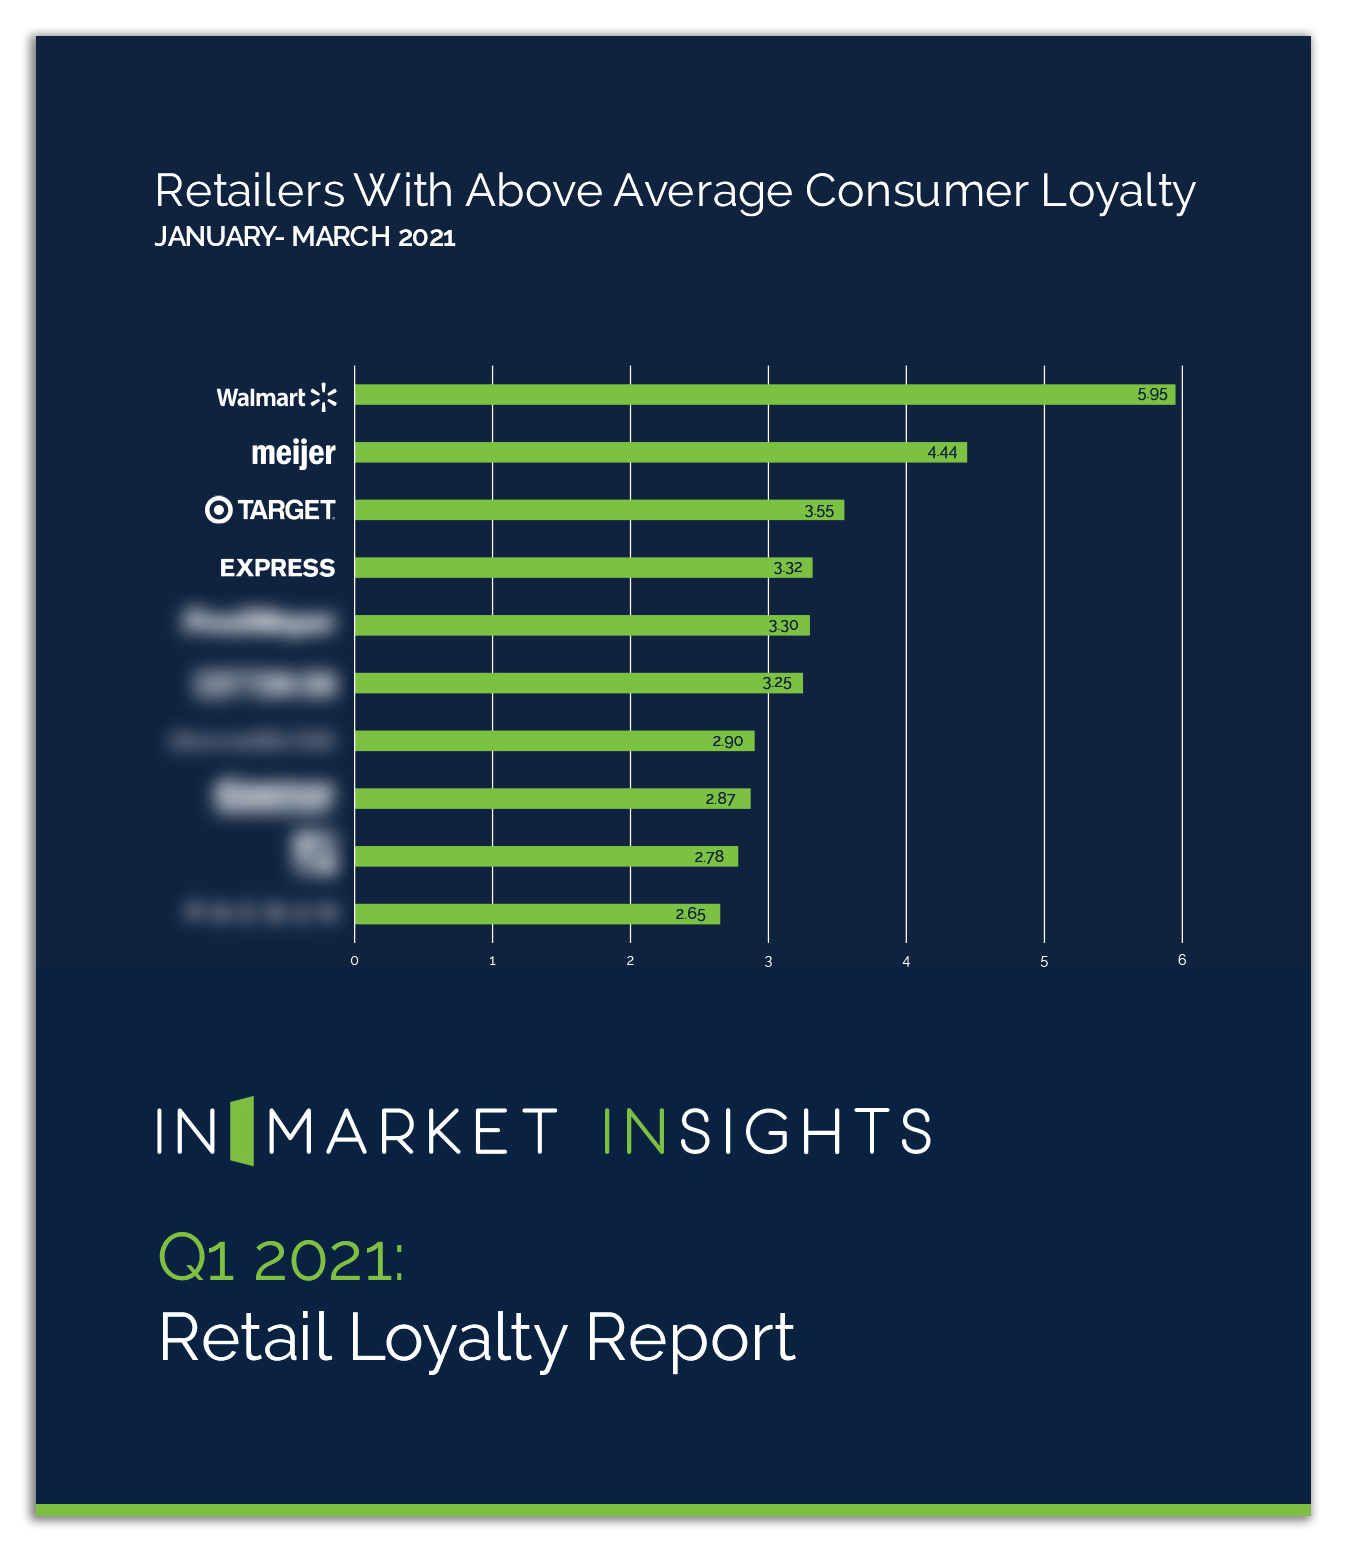
InMarket InSights Q1 2021 Retail Loyalty Report
With more than 150 million doses of the COVID-19 vaccine administered by the end of Q1 2021, there’s a renewed sense of hope to exit our homes. In our Q1 2021 Retail Loyalty Report, we’ve analyzed consumer loyalty to assess which chains have healthy repeat visits. Our report finds that many clothing retailers—workwear apparel, “going out again” clothing retailers, and teen-centric labels in particular—are becoming increasingly popular as offices, campuses, and restaurants continue to reopen. The trend of updating closets is a strong indicator that consumers are ready to return back to normal. Download the report to learn more! |
Download The Report Below! × |
|---|
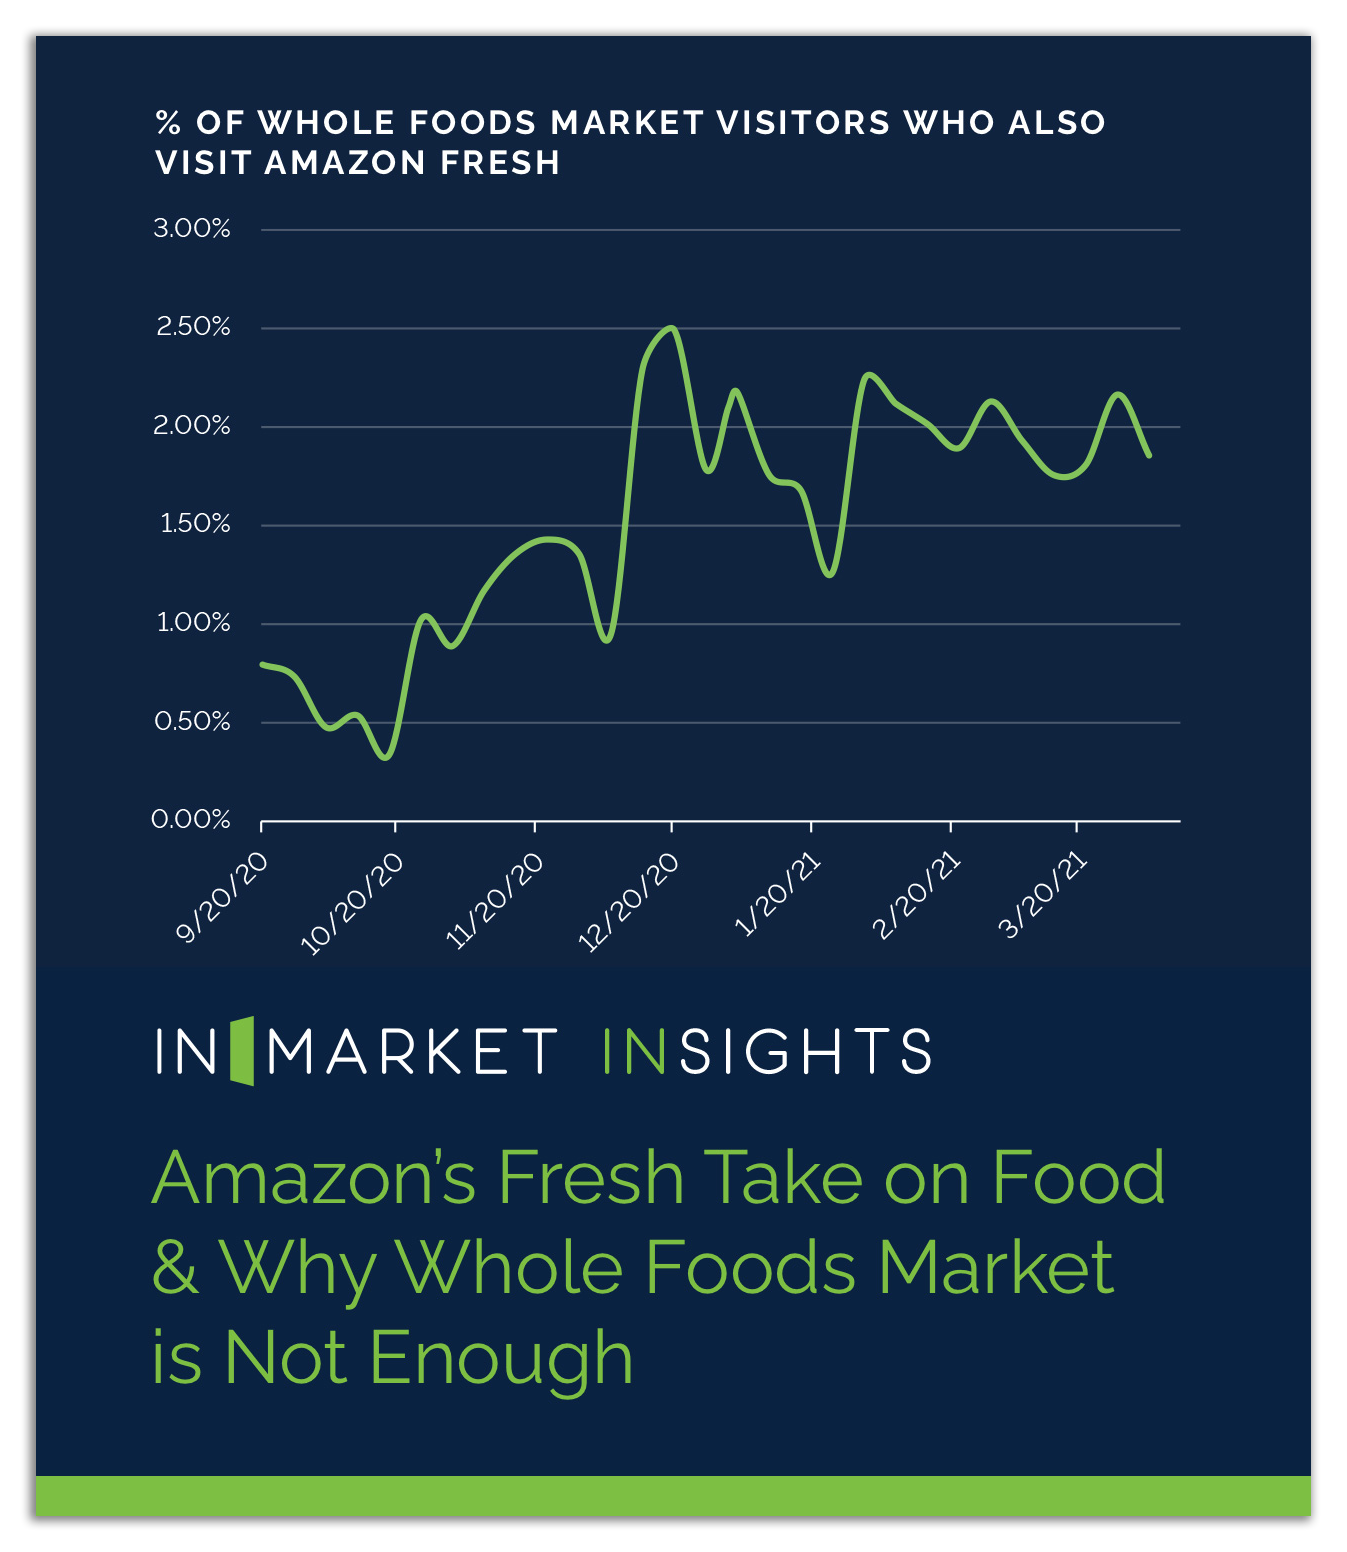
InMarket InSights Amazon Fresh Vs Whole Foods
Amazon has been rapidly expanding their new chain of Amazon Fresh stores, which focus on everyday low costs. However, while adding a new brand of grocery stores to their roster of already popular and well-established Whole Foods Market chain may pose a risk of cannibalizing its business, InMarket’s data has found key differences that indicate the new grocery chain may be the link to capturing an entirely missed segment of customers. Download the report to learn more! |
Download The Report Below! × |
|---|
InMarket InSights 2021 Marketing Recovery Playbook
After a year of unprecedented changes, a return to “normal” is on the horizon. For marketers, the period of transition ahead leaves many open questions of how to best plan strategies to achieve success. Fortunately, InMarket’s 2021 Marketing Recovery Playbook identifies 10 key opportunities for marketers to embrace as the country emerges from the pandemic. Download the report to learn more! |
Download The Report Below! × |
|---|
InMarket InSights Q1 2021 Foot Traffic Report
The Q1 2021 Foot Traffic InSights report is here! After a tumultuous year, 2021 began with signs of hope as vaccine rollout began across the country, helping to dissipate consumer fears for health and safety. Compared to a year ago, we find that foot traffic is more stable in Q1 2021, with fewer erratic spikes and drops in foot traffic across all five retailer categories analyzed. Download the report to learn more! |
Download The Report Below! × |
|---|
InMarket InSights Easter and Passover 2021
How consumers celebrate Easter and Passover during the recovery period of COVID-19 and vaccine rollouts have major implications about purchasing and in-store shopping trends in the coming months. Pinpointing early trends are vital for advertisers to swiftly move with quickly evolving consumer tastes, meet them at their greatest moment of need, and keep branded messaging hyper-relevant to drive strong ROAS. Download the report to learn more! |
Download The Report Below! × |
|---|
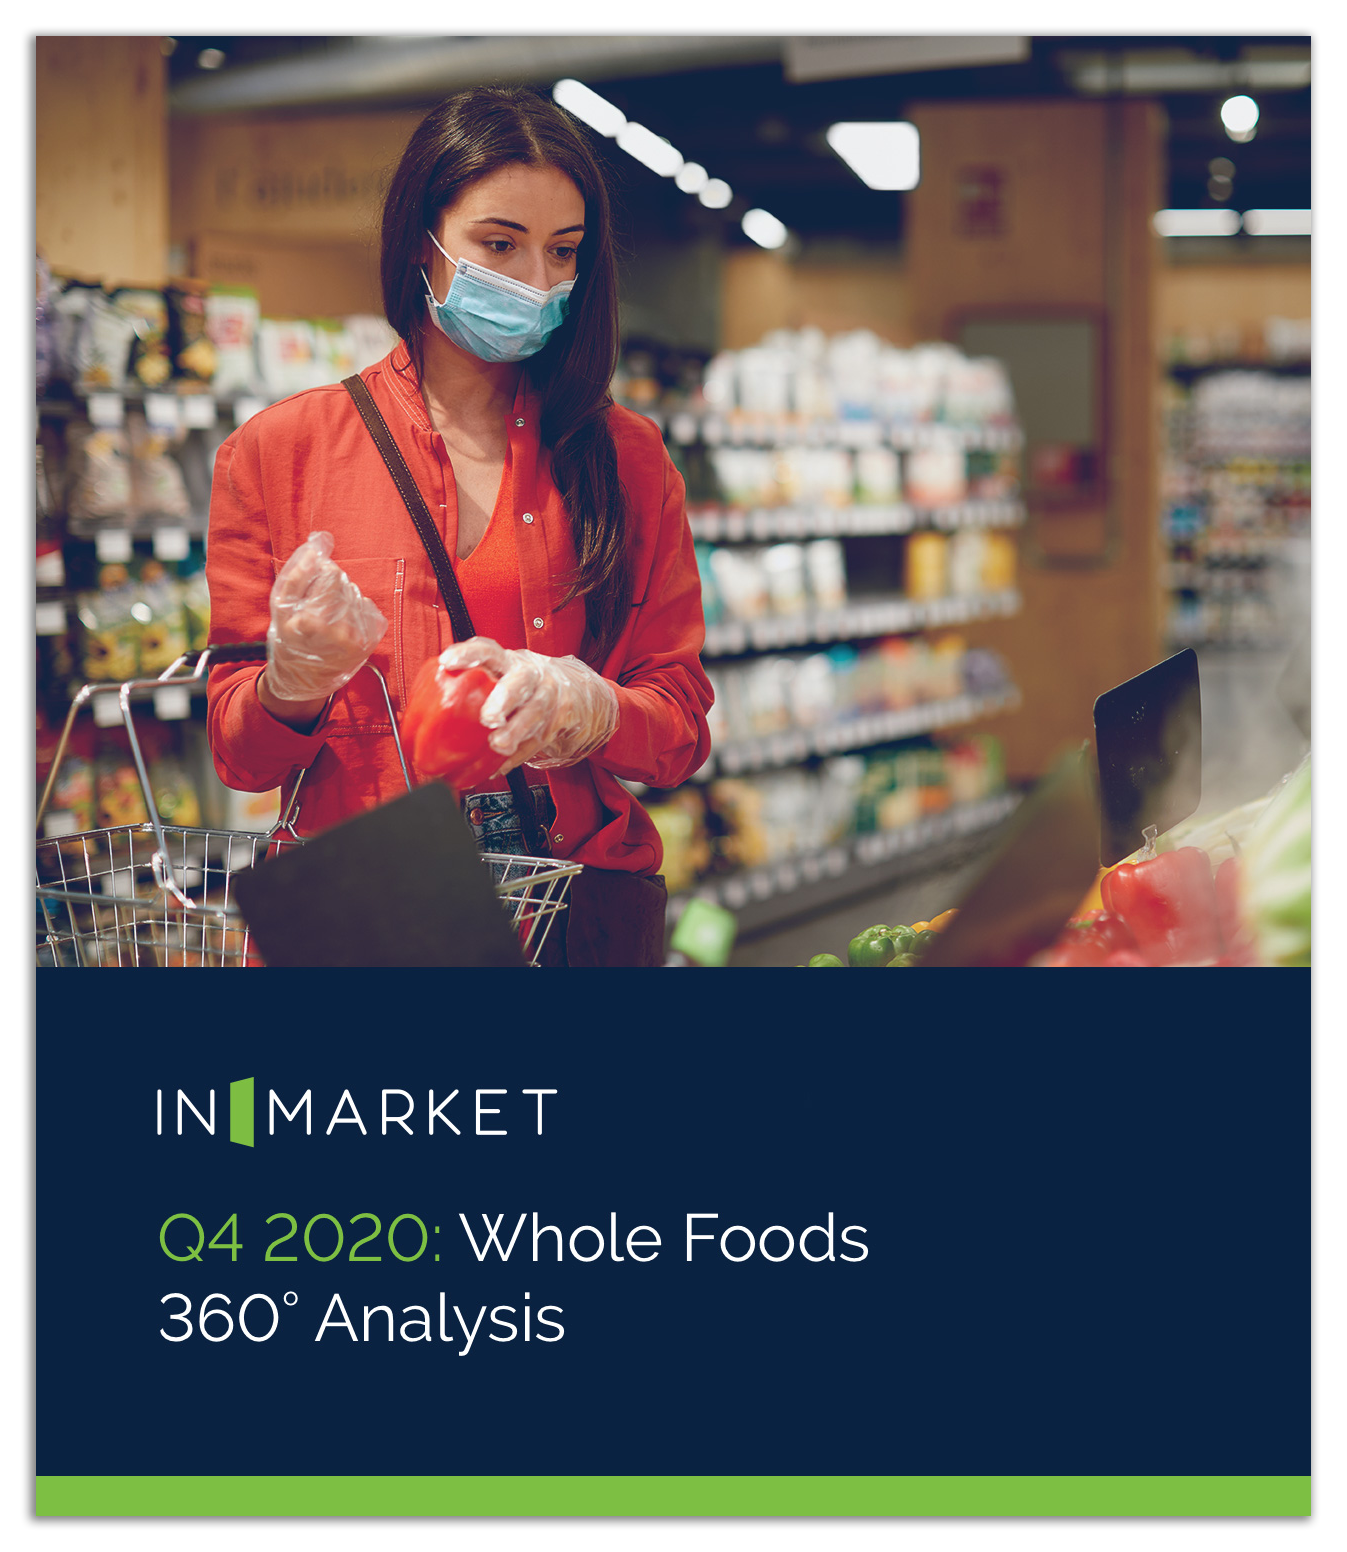
InMarket InSights Q4 2020 Whole Foods 360 Analysis
Since Amazon purchased Whole Foods in 2017, InMarket has analyzed the visitation behavior of consumers to the grocery chain. In our latest quarterly analysis, foot traffic analysis shows a 40% decline in Q4 visitation to Whole Foods, compared to Q4 2019. Download the report! |
Download The Report Below! × |
|---|
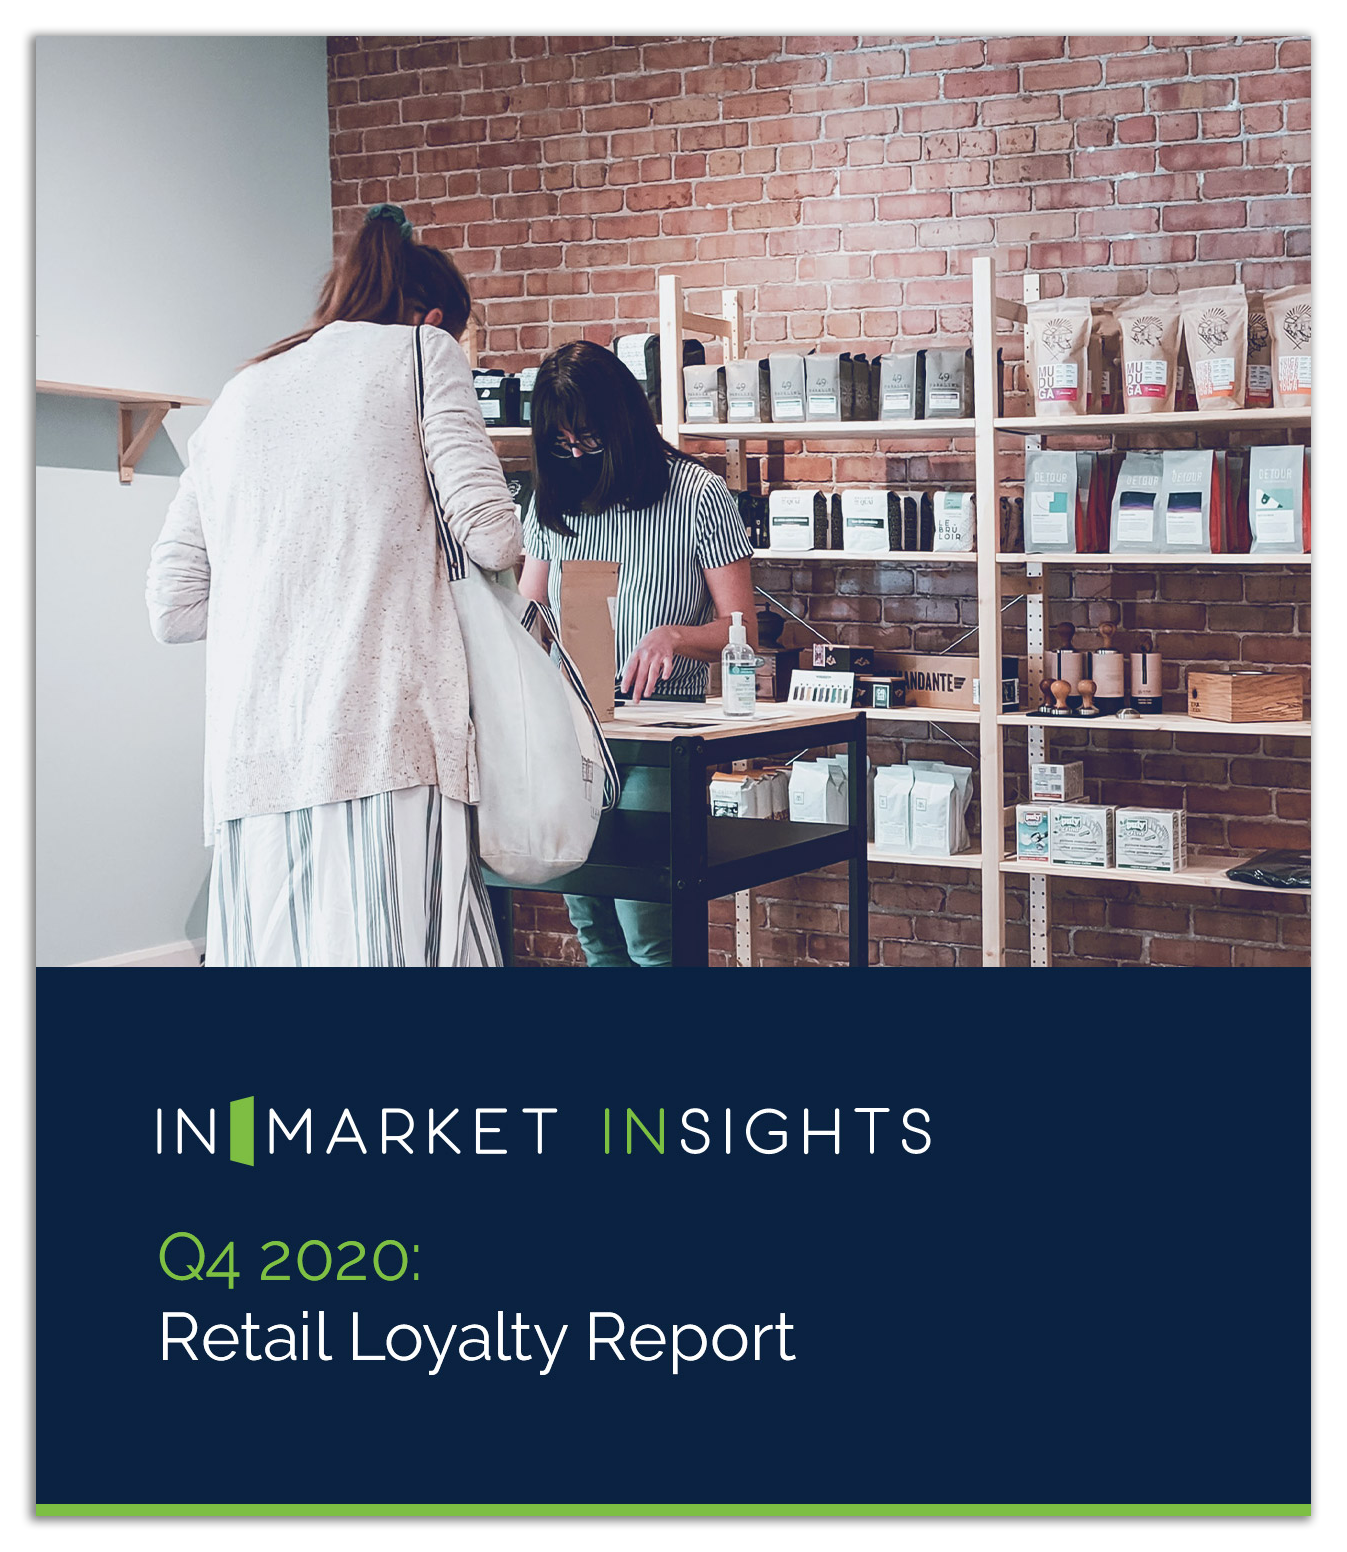
InMarket InSights Q4 2020 Retail Loyalty Report
In an effort to cater to consumers mindful of their health, retailers worked to minimize store crowds by starting holiday deals earlier than ever, while encouraging omnichannel shopping opportunities and curbside pickup. To understand consumer loyalty during the tumultuous quarter, InMarket analyzed US consumers’ foot traffic patterns and visitation history from October to December 2020. Download the report! |
Download The Report Below! × |
|---|
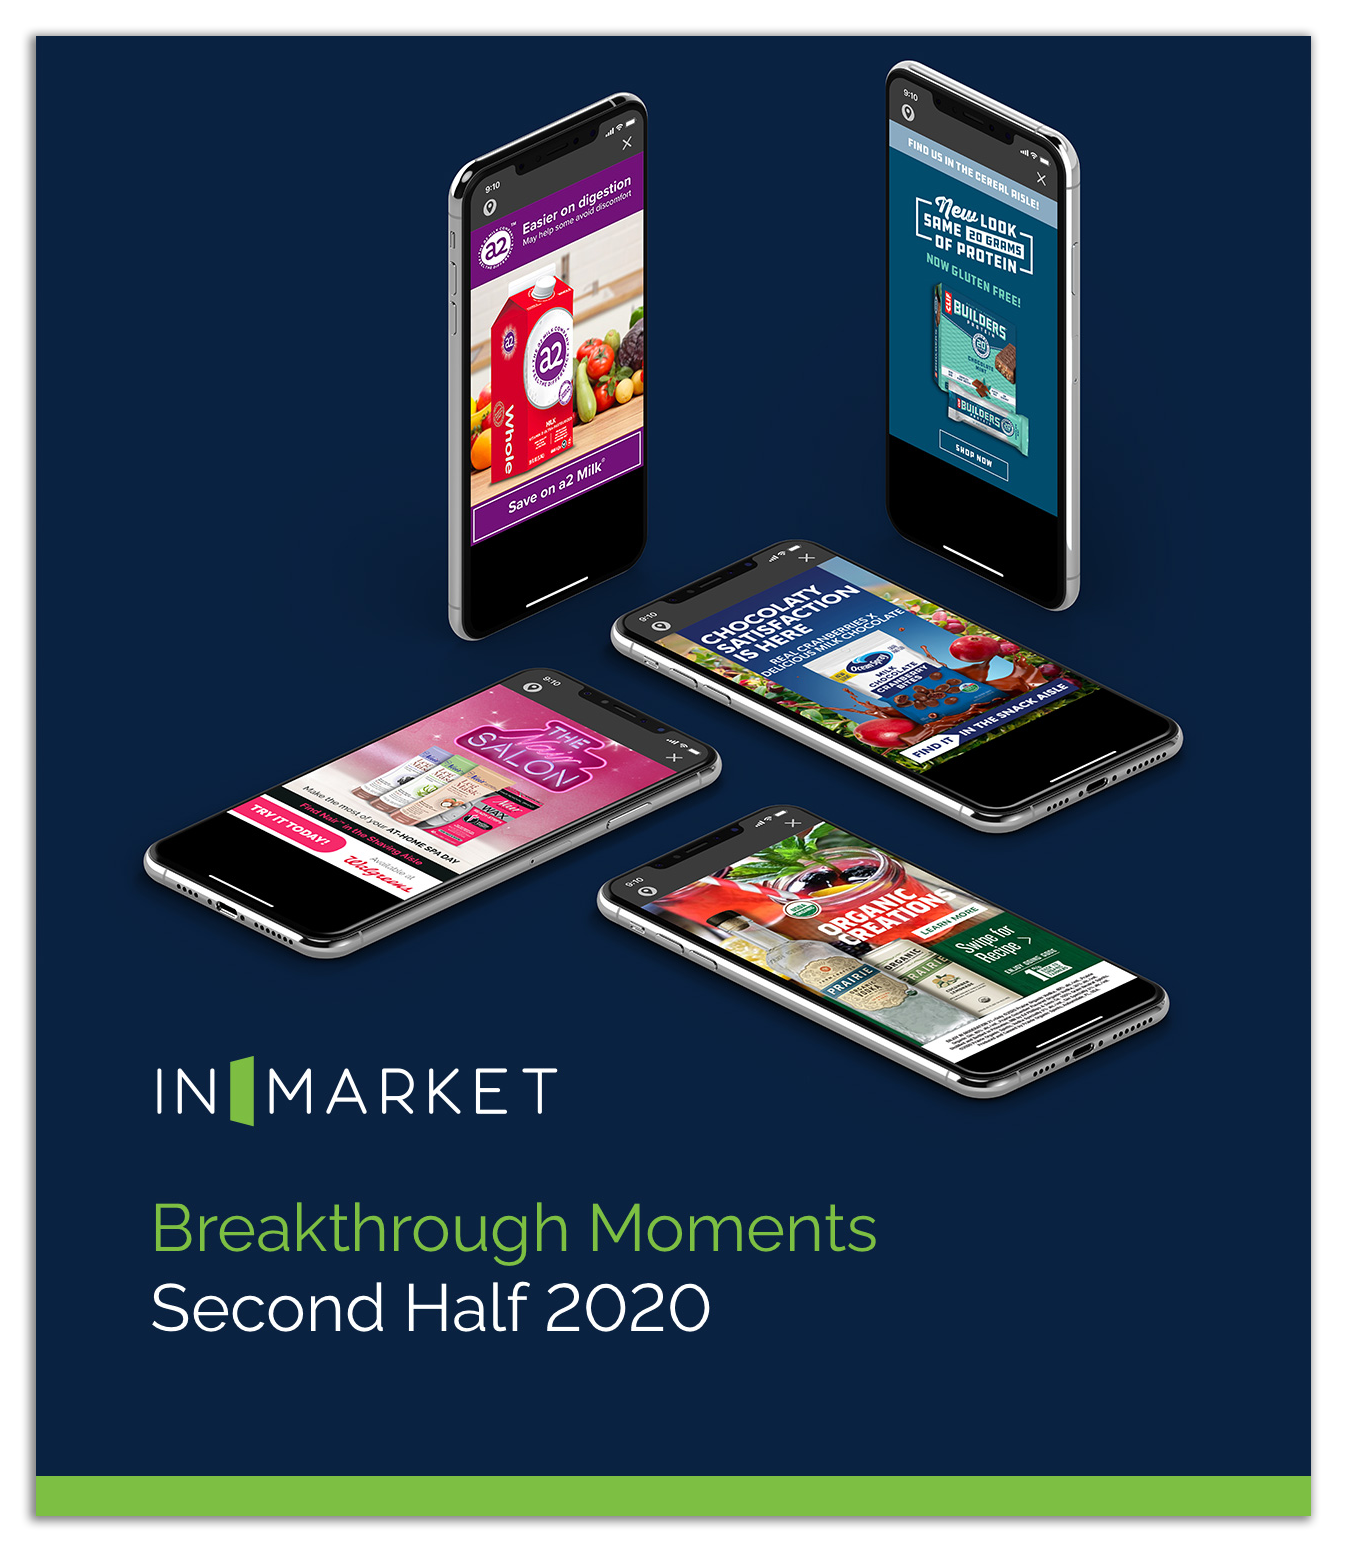
2020 Breakthrough Moments 2nd Half
Want to learn more about the success factors behind a successful Breakthrough Moment? In this webinar, learn how InMarket helps brands and agencies stand out from the crowd by building powerful, interactive brand experiences that drive strong engagement and consumer action. Download the report! |
Download The Report Below! × |
|---|
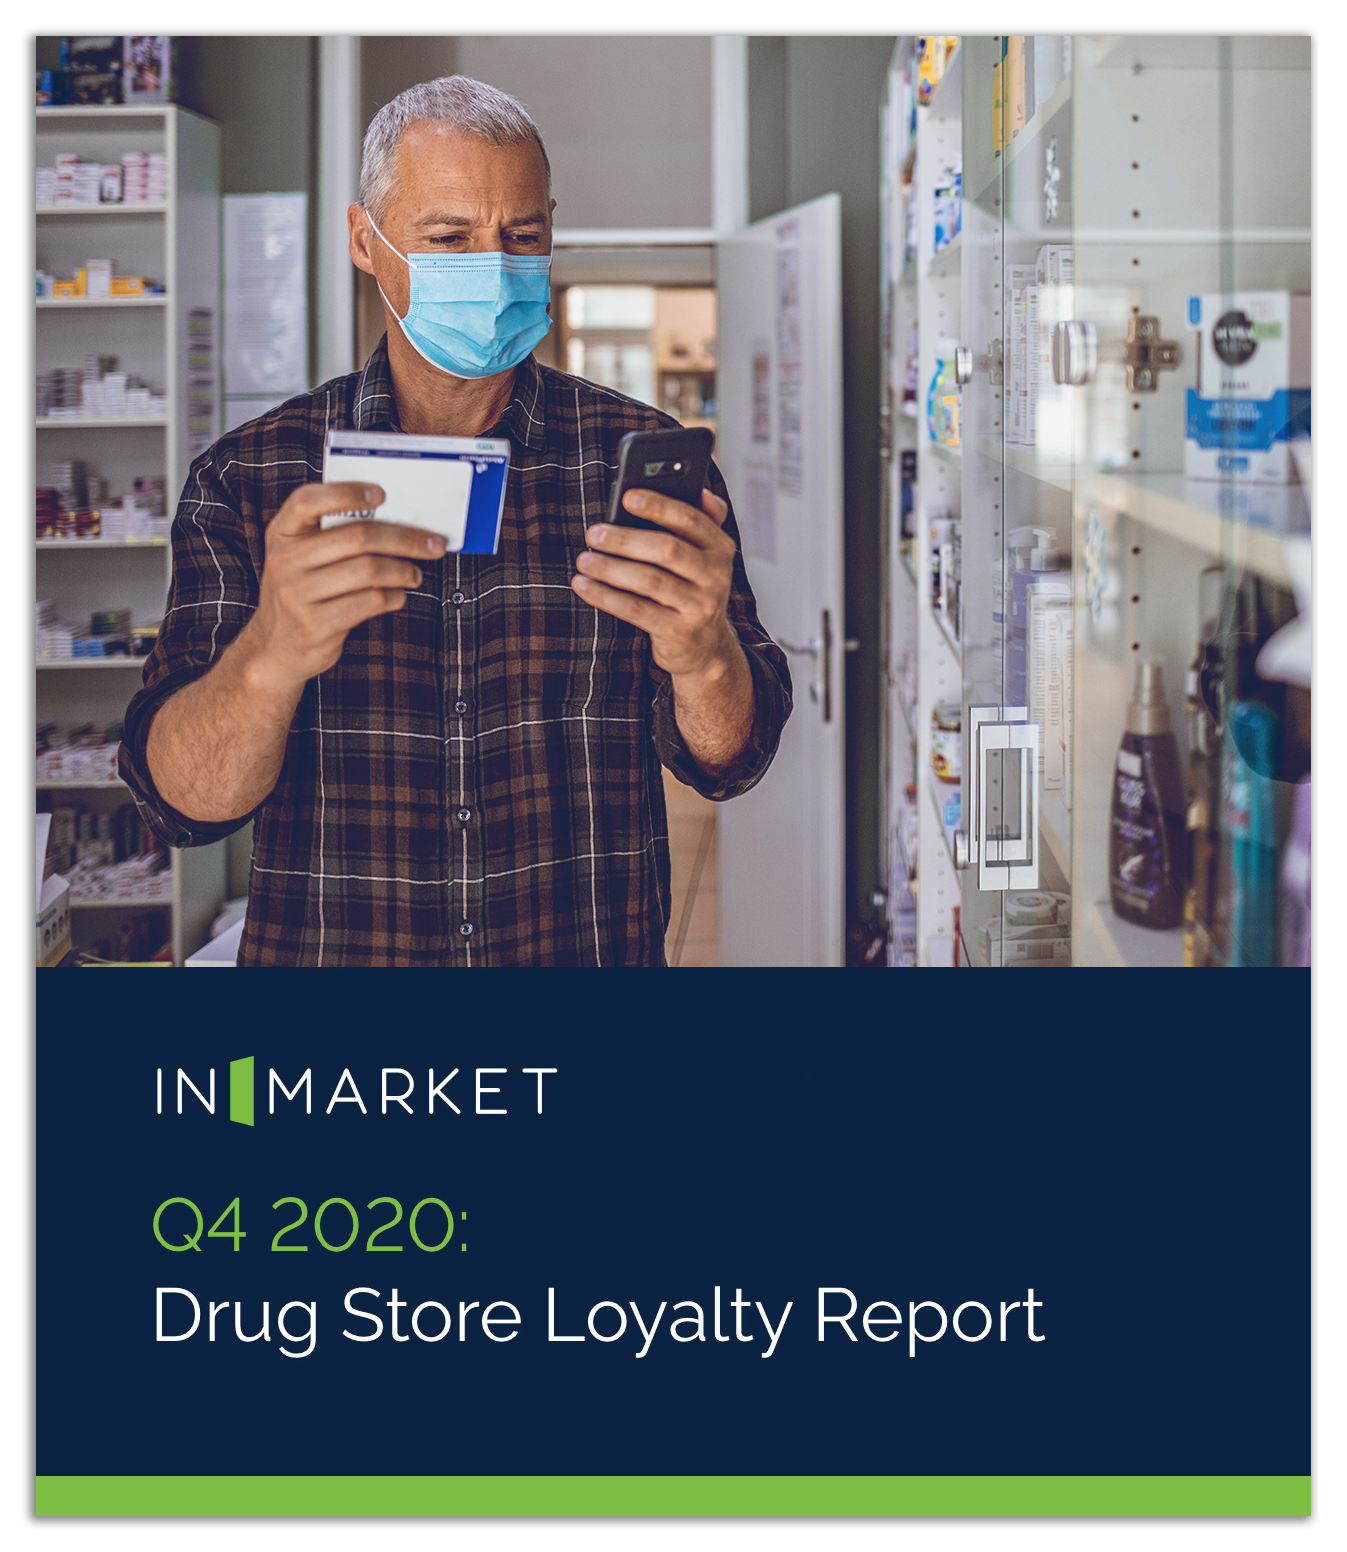
InMarket InSights Q4 2020 Drug Store Loyalty Report
For health-conscious shoppers, social distancing and limiting contact with others has been a central concern. As demand for accessing prescriptions safely continues to rise, many drug stores and pharmacies have either began offering or heavily emphasizing curbside pickup and drive-thru services. InMarket has analyzed consumer loyalty to assess which chains have been successful in garnering repeat visits. Download the report! |
Download The Report Below! × |
|---|
InMarket InSights Q4 2020 Foot Traffic Report
During a typically busy shopping season, average Q4 2020 foot traffic to retailers across all categories dropped 33.8% for 2 weeks before Christmas Day—likely as a result of consumers quarantining due to COVID-19 concerns ahead of holiday travel and gatherings. InMarket explores these insights based on real-time consumer behaviors to help brands understand how the pandemic has impacted shopping behaviors. Download the report! |
Download The Report Below! × |
|---|
InMarket InSights 6 Myths of Attribution, Busted
Foot Traffic Attribution is an incredibly valuable tool for marketers that gives insight into the offline behaviors of consumers. In this latest publication, we aim to debunk 6 common misbeliefs about location-based measurement solutions. Learn how LCI®, the industry standard for offline attribution, helps marketers optimize omnichannel marketing to drive business growth and maximize ROAS. Download the report! |
Download The Report Below! × |
|---|
InMarket InSights P2PI Q3 2020 Snapshots
Understanding consumer behavior is crucial to engaging with your audience in a meaningful way, and also driving huge ROI—which is why Path to Purchase Institute has partnered with location data company, InMarket, to analyze consumer visitation patterns every quarter for the top retailers in the United States. Shoppers show their demand for particular chains with their feet, and by observing these data patterns, industry analysts are able to accurately predict macro trends about purchase behavior at scale. Download the Almanacs! |
Download The Report Below! × |
|---|
InMarket InSights 2020 Almanac Series
InMarket’s 2020 Consumer Almanac series leverages first-party, permission-based data collected from InMarket’s SDK platform of Comscore-verified monthly active users in the US to analyze trends for the biggest household retail brands across 12 verticals—with insights to help marketers understand how to best meet demand as consumer behavior changes over time. Download the Almanacs! |
Download The Almanacs Below! × |
|---|
InMarket InSights Q3 2020 Whole Foods
In this InMarket InSights Report Card, we’ve examined how shoppers behaved at Whole Foods locations from 7/1/2020-9/30/2020. The analysis includes visitation habits, frequency, and dwell time inside the store and on their path to purchase. Download the report and learn more! |
Download Report Below! × |
|---|
InMarket InSights The InMarket Measurement Playbook
Learn more about how Location Conversion Index (LCI), the industry’s leading offline attribution solution, can help optimize your omnichannel marketing mix, drive real business growth, and maximize ROAS. Download the report and learn more! |
Download Report Below! × |
|---|
InMarket InSights InMarket InSights
InMarket’s 2021 Digital Marketing Playbook lays out 8 key marketing musts to embrace in the new year to drive continued success throughout 2021. Download the report and learn more! |
Download Report Below! × |
|---|
InMarket InSights InMarket InSights
In our latest InMarket InSights report, Gift Cards During the Holidays 2020, we analyze the trends surrounding the increased popularity of gift cards and identify category leaders across electronics, apparel/shoes, department stores, and many others. What’s more, the report reveals several gift card spending trends including the number of unique gift card purchasers, the average spend on gift cards, and the average number of gift card transactions per device. Download the report and learn more! |
Download Report Below! × |
|---|
InMarket InSights InMarket InSights
In this report, you’ll find the Q3 2020 Retail Consumer Loyalty leaders and laggards to see who adapted best to changing consumer behaviors. For the second quarter in a row, Walmart had the highest consumer loyalty score. Download the report and learn more! |
Download Report Below! × |
|---|
InMarket InSights InMarket InSights
Through the lens of InMarket’s permission-based location data, InMarket’s Q3 2020 Foot Traffic Report identifies impactful shopping dates based on the heaviest foot traffic across Discount Stores, Big Box Stores, Convenience Stores, Department Stores, and Drug Stores. These insights allow brands to better support consumer demand and engage shoppers during the moments that matter—while they are in the purchase process. Download the report and learn more! |
Download Report Below! × |
|---|
InMarket InSights COVID-19 Impact Report:
InMarket’s latest report, COVID-19: Holiday Shopping 2020, is a multi-level report that acts as a stand-in crystal ball to see what upcoming holiday season behaviors might look like. Download the report and learn more! |
Download Report Below! × |
|---|
InMarket InSights COVID-19: Home for the Holidays
As supply chains recover and optimism about the economy grows, campaign planning for Thanksgiving is well underway by brands across the country. Download InMarket’s latest COVID-19 Impact Report, Home for The Holidays, to access important data that uncovers how consumers are feeling about Thanksgiving 2020. Download the report and learn more! |
Download Report Below! × |
|---|
InMarket InSights COVID-19: Behaviors Before
Although uncertainty hangs over this year’s Halloween activities due to COVID-19, InMarket’s Confections and Infections report reveals more than 60% of adults surveyed are optimistic that Halloween goers will find creative, fun, and safe ways to enjoy the upcoming holiday. Supporting the early optimism, U.S. sales of Halloween candy were up 13% over last year in the month ending September 6. In fact, average candy spend per device is also up significantly year-over-year according to InMarket data.
Download the report and learn more! |
Download Report Below! × |
|---|
InMarket InSights COVID-19: Behaviors Before
InMarket’s latest COVID-19: Behaviors Before and After Survey reveals an uptick in consumer optimism towards the economy and a growing willingness to shop in stores. In this third installment of the report, find out how much consumer sentiment and shopping behaviors have shifted since March and June, and its impact on purchases as we head into the 2020 holiday season. Download the report and learn more! |
Download Report Below! × |
|---|
InMarket InSights COVID-19
The Sturgis Motorcycle Rally, an annual event which features ten days of riding, food, and music, typically sees half a million attendees each year. However, this year after the event concluded, the Sturgis Rally was directly tied to at least one hundred positive cases in eight states. InMarket sought to understand how large-scale events like the Sturgis Motorcycle Rally impact the spread of COVID-19. We compiled data to profile the average Sturgis Rally attendee, proclivity for certain locations and habits, and where they went during and after the rally in order to better understand the potential impact on new cases and potential outbreaks nationwide. Download the report and learn more! |
Download Report Below! × |
|---|
InMarket InSights Q2 2020 Whole Foods
While Whole Foods, backed by Ecommerce heavyweight Amazon, is popular for its specialty food items, health-oriented products, Amazon Lockers, and Prime membership benefits, it was not exempt from the COVID-19 pandemic. Despite its well-developed omnichannel strategies and its ability to remain open throughout the pandemic, Whole Foods has experienced a deep decline in visits year over year.
|
Download Report Below! × |
|---|
InMarket InSights COVID-19 Restaurant and Bar Visits
Reopening has coincided with a growing number of confirmed cases in many states—with dine-in restaurants and bars in particular to blame. InMarket uncovered how strong of a correlation there was between restaurant and bar visits, and increases in COVID-19 cases in three surge states (California, Florida, Texas). Among the key findings were a very strong correlation—of up to 99.9% statistical significance—in visits to bars and restaurants, and an increase in new cases 14 days later. |
Download Report Below! × |
|---|
InMarket InSights 2020 Holiday Playbook
We've compiled 4 easy ways to optimize your game plan in our 2020 Holiday Playbook, where we outline how to:
|
Download Report Below! × |
|---|
InMarket InSights 2020 Digital-First Holiday
As interest in online shopping and online to curbside pickup accelerate at a rapid pace due to COVID-19, consumers and marketers alike are increasingly integrating digital-first decisions into their 2020 holiday plans.
|
Download Report Below! × |
|---|
InMarket InSights Q2 2020 Retail
COVID-19 is upending traditional retail business. Between closures, openings, and (again) closures, retailers are struggling to understand unpredictable customer behaviors while losing share to digital competitors. InMarket's trusted Loyalty Index Score has analyzed a number of retailer criteria to remove that uncertainty, and distinguish the survivors from the thrivers. |
Download Report Below! × |
|---|
InMarket InSights First Half 2020 Breakthrough Moments
What does it take to break through the clutter and drive record engagement and click through rates? We’ve picked the best-of-the-best campaigns for the first half of 2020 and share our thoughts on what made each a Breakthrough Moment! |
Download Report Below! × |
|---|
InMarket InSights Q2 2020
In this Q2 2020 report, we’ve mapped fluctuations during key events and have identified the most impactful shopping dates based on the heaviest foot traffic in each retail category. These insights allow brands to better support consumer demand and initiate conversations that engage shoppers during the moments that matter—while they are in the purchase process. |
Download Report Below! × |
|---|
InMarket InSights COVID-19 Back To School Shopping
In this InMarket Impact Report, we observe what consumers are planning to buy in addition to when and how they plan to buy. We also analyzed the data by student age groups to provide additional insights on shopping behaviors. |
Download Report Below! × |
|---|
InMarket InSights COVID-19 Summer Travel
As we kick off the official start of summer 2020, many are asking, “Where will Americans call paradise during the pandemic this summer?” While vacation plans are evolving due to COVID-19 concerns and an uncertain economy, they will clearly continue as Americans spend $101 billion on summer vacations per year. Many consumers rely on summer vacation to decompress and to take care of their mental health—making this year’s getaway perhaps the most important of all.
|
Download Report Below! × |
|---|
InMarket InSights COVID-19 Behaviors Before and After
In an uncertain world, data matters. What consumers say and do are critical to understanding consumer behavior, and shows that how they feel about their environment might have an impact on their future decisions and behaviors.
|
Download Report Below! × |
|---|
InMarket InSights 360 Analysis
As stay at home orders spread across the country in late Q1 2020, essential businesses such as grocery stores were among the few businesses permitted to remain open. As a known retailer of health-oriented products, specialty food items, and organic produce, Whole Foods has continued to serve the public during the pandemic and has implemented key modifications like special shopping hours for seniors, crowd control measures including social distancing rules and reduced hours to sanitize stores in an effort keep its customers and employees safe and healthy.
|
Download Report Below! × |
|---|
InMarket InSights COVID-19:
With each passing week, the issue of reopening the economy—in particular, gyms—has been a divisive and hotly debated topic with some even protesting in front of fitness centers. It’s clear Americans are itching to return to their familiar routines. As stay-at-home orders are slowly being lifted and states are adopting a phased approach to reopening their economies, some Americans are gradually heading back to their fitness studio or gym of choice.
|
Download Report Below! × |
|---|
InMarket InSights COVID-19:
When COVID-19 forced restaurants, bars, and other settings where alcohol is served to close or limit sales, we assumed alcohol sales would dry up. However, quite the opposite has happened: alcohol sales are flourishing. Alcoholic beverage sales jumped 55% in the third week of March YOY. In fact, Spirits sales grew 75%, wine by 66%, flavored malts and ciders by 42%, and beer by 34%. Regular patrons of restaurants, bars, and other venues with liquor find themselves looking for new ways to both socialize and enjoy their favorite beverage of choice - be it a zoom happy hour or dinner with family. As a result, the retail alcohol industry is booming, and new patterns are emerging as people adapt to the “new normal.” By observing the purchase trends of wine and spirits, we’ve found that consumers are gravitating towards value-priced brands during these times of economic uncertainty. In this report, we’ve leveraged InMarket’s data to rank the most popular spirits and wine brands that consumers are buying during the COVID-19 pandemic. |
Download Report Below! × |
|---|
InMarket InSights COVID-19 Beer Brand Buzz
Americans’ thirst for alcohol has increased since the coronavirus pandemic began. While COVID-19 has stopped the restaurant and bar industries in their tracks, alcohol sales are still buzzing. According to Nielsen, alcoholic beverage sales jumped 55% in late March compared to the same time last year, and purchases are expected to increase as the crisis continues to unfold. While sales of liquor are soaring, beer sales are also accelerating, with YOY sales of 34%. Most notably, the beers that saw the greatest increases since the pandemic hit the U.S. have been budget-friendly brews with fewer carbs and calories. In this brief, we’ve tapped into InMarket’s data to rank the top ten beer brands that consumers are buying during the COVID-19 pandemic. |
Download Report Below! × |
|---|
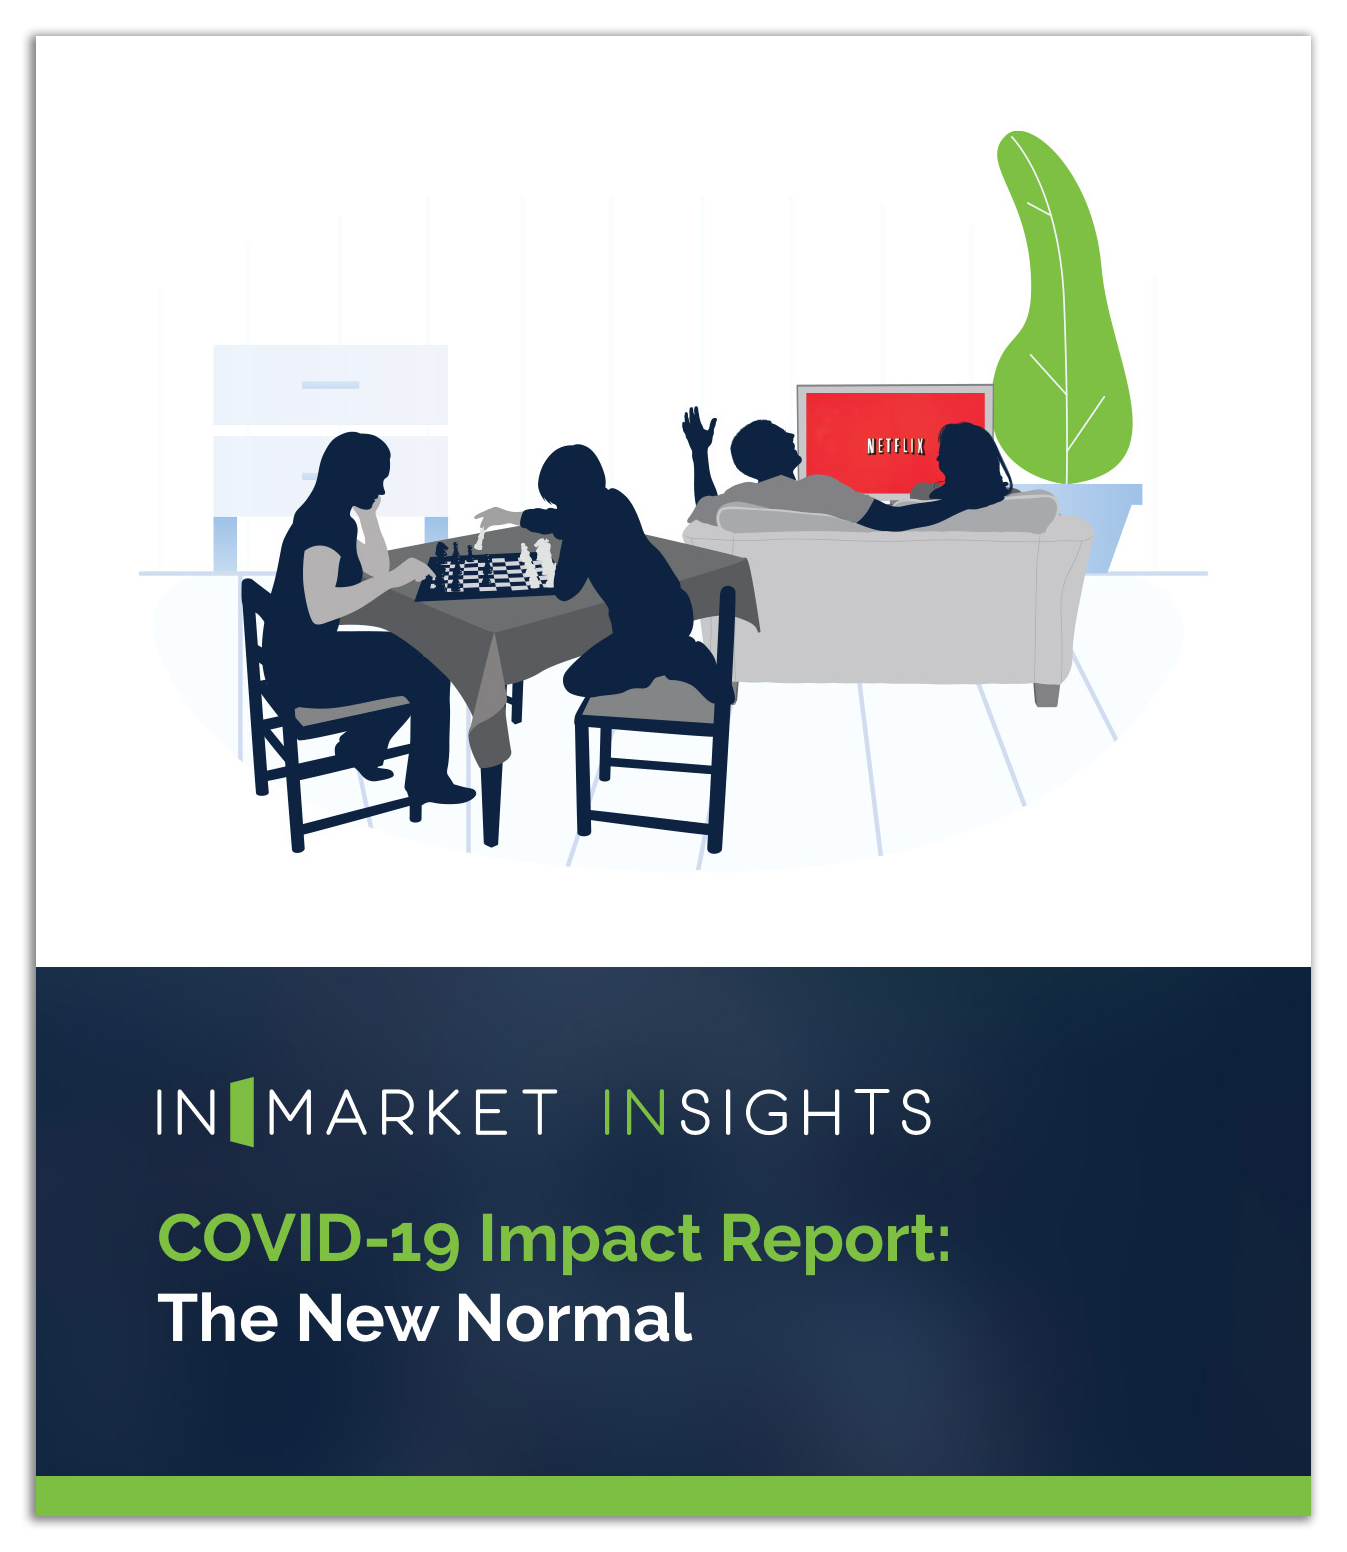
InMarket InSights COVID-19 Impact Report:
States across the country are beginning to slowly open, and while each state has set their own guidelines, many have implemented a phased approach to opening. As a result, we are beginning to see a new phase of the pandemic linked to America’s re-opening: hope. In this COVID-19 Impact Report, we explore the changes observed in consumer behavior and paint a picture of what today’s American homes look like by tracking the increase in purchases for key products/services pre and post pandemic. Specifically, we’ll reveal how consumers have evolved from the frenzied buying of essential goods at the start of the pandemic to settling in at home and adjusting to the “new normal.” |
Download Report Below! × |
|---|
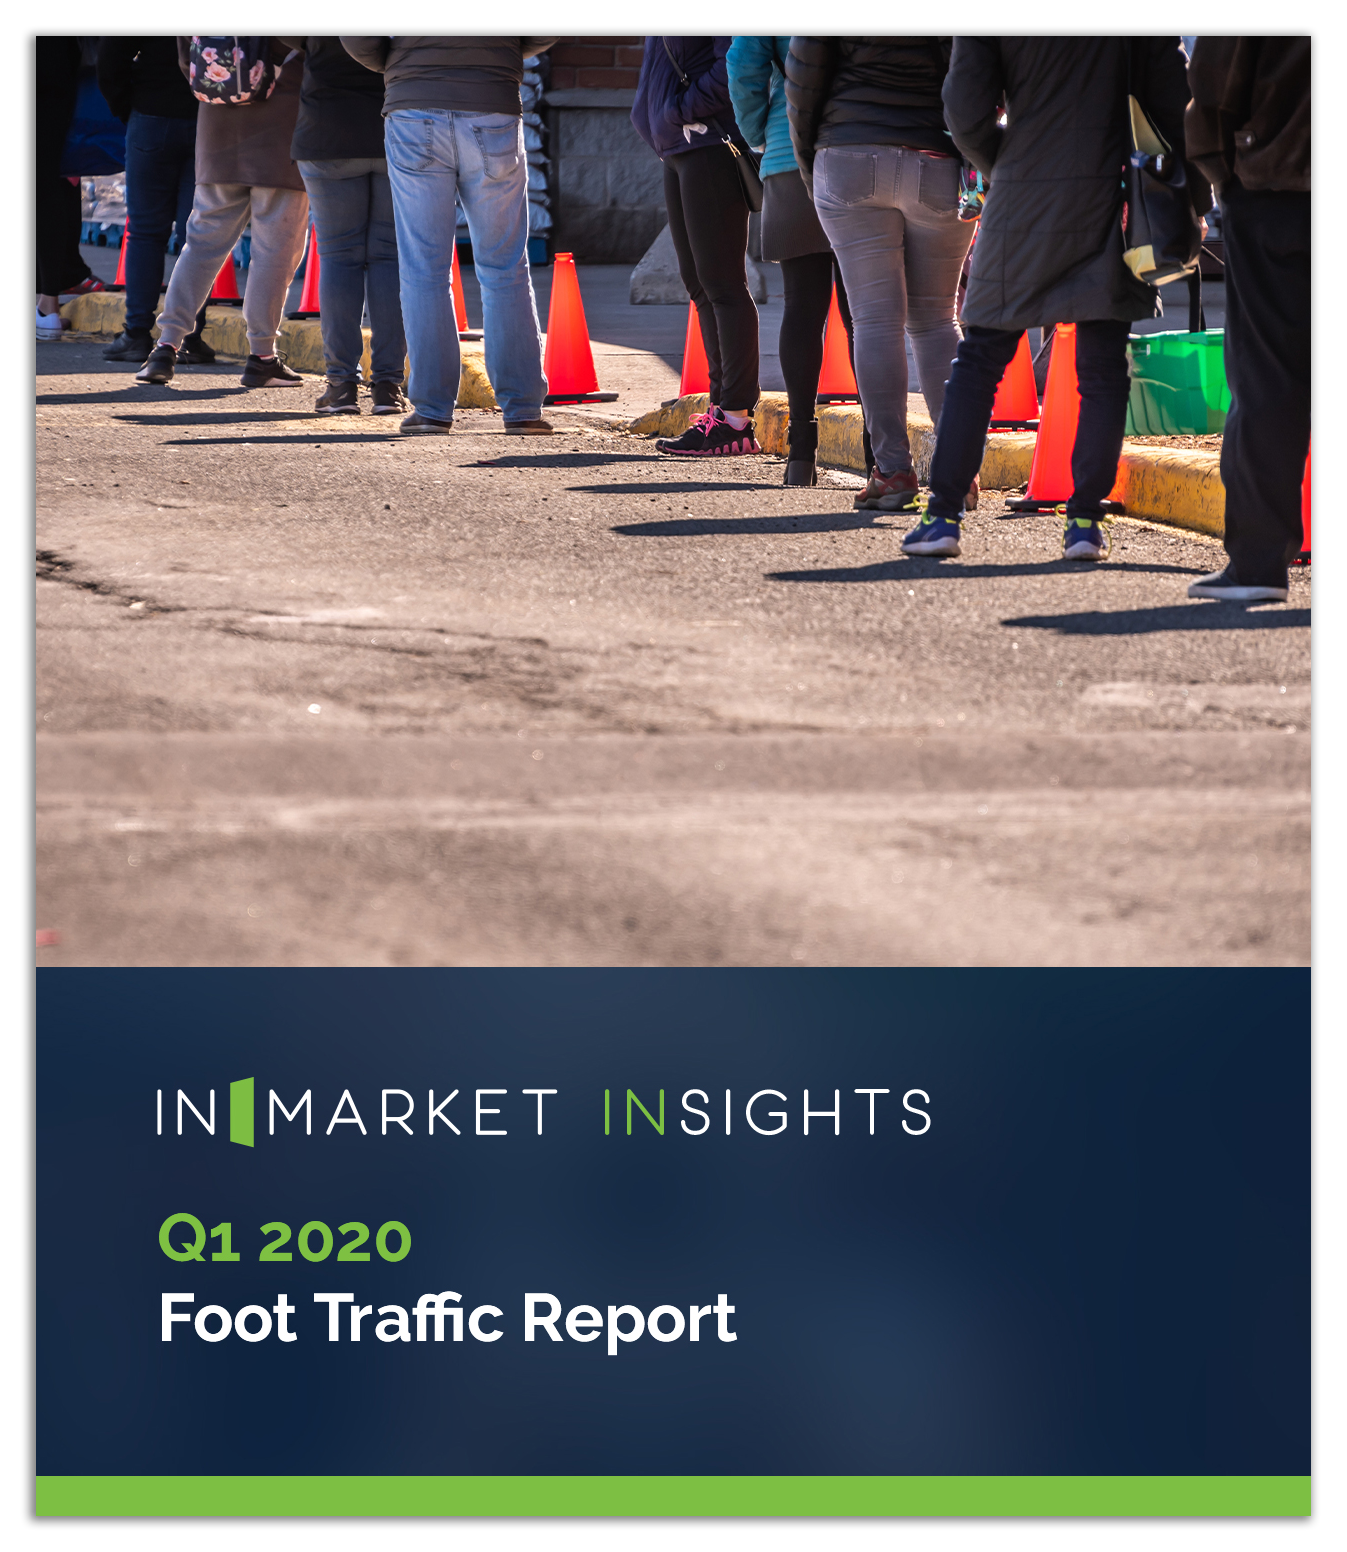
InMarket InSights Q1 2020 Foot Traffic Report
During a time when COVID-19 has undoubtedly impacted the lives of both consumers and businesses in the US, observing real-time foot traffic trends is vital: we can better understand how consumer behavior is changing, which allows brands to adapt quickly so they can maximize ROAS. InMarket leveraged first-party location data collected from 50MM+ monthly active smartphone users to map fluctuations during key events. We identified shopping dates and shifting consumer visitation patterns for retail categories most impacted by COVID-19. These insights allow brands to better support consumer demand through staffing and initiate conversations that engage shoppers during the moments that matter—while they are in the purchase process. |
Download Report Below! × |
|---|
InMarket InSights Q4 2019 Look Back Retail Loyalty Report
COVID-19 has reshaped American life: the widespread adoption of social distancing and stay-at-home orders has resulted in the shut down of non-essential businesses, and could accelerate the closures of 100,000 retail locations by 2025. In an effort to evaluate the health and long-term viability of retailers, InMarket created a Loyalty Index Score (LIS). The InMarket LIS looks at the average number of visits over a set period of time and is a key indicator of each retailer’s ability to retain customers and grow lifetime value. Loyalty, combined with multi-channel strategies and a strong balance sheet, will help distinguish the survivors and those who will prosper through this crisis and beyond. |
Download Report Below! × |
|---|
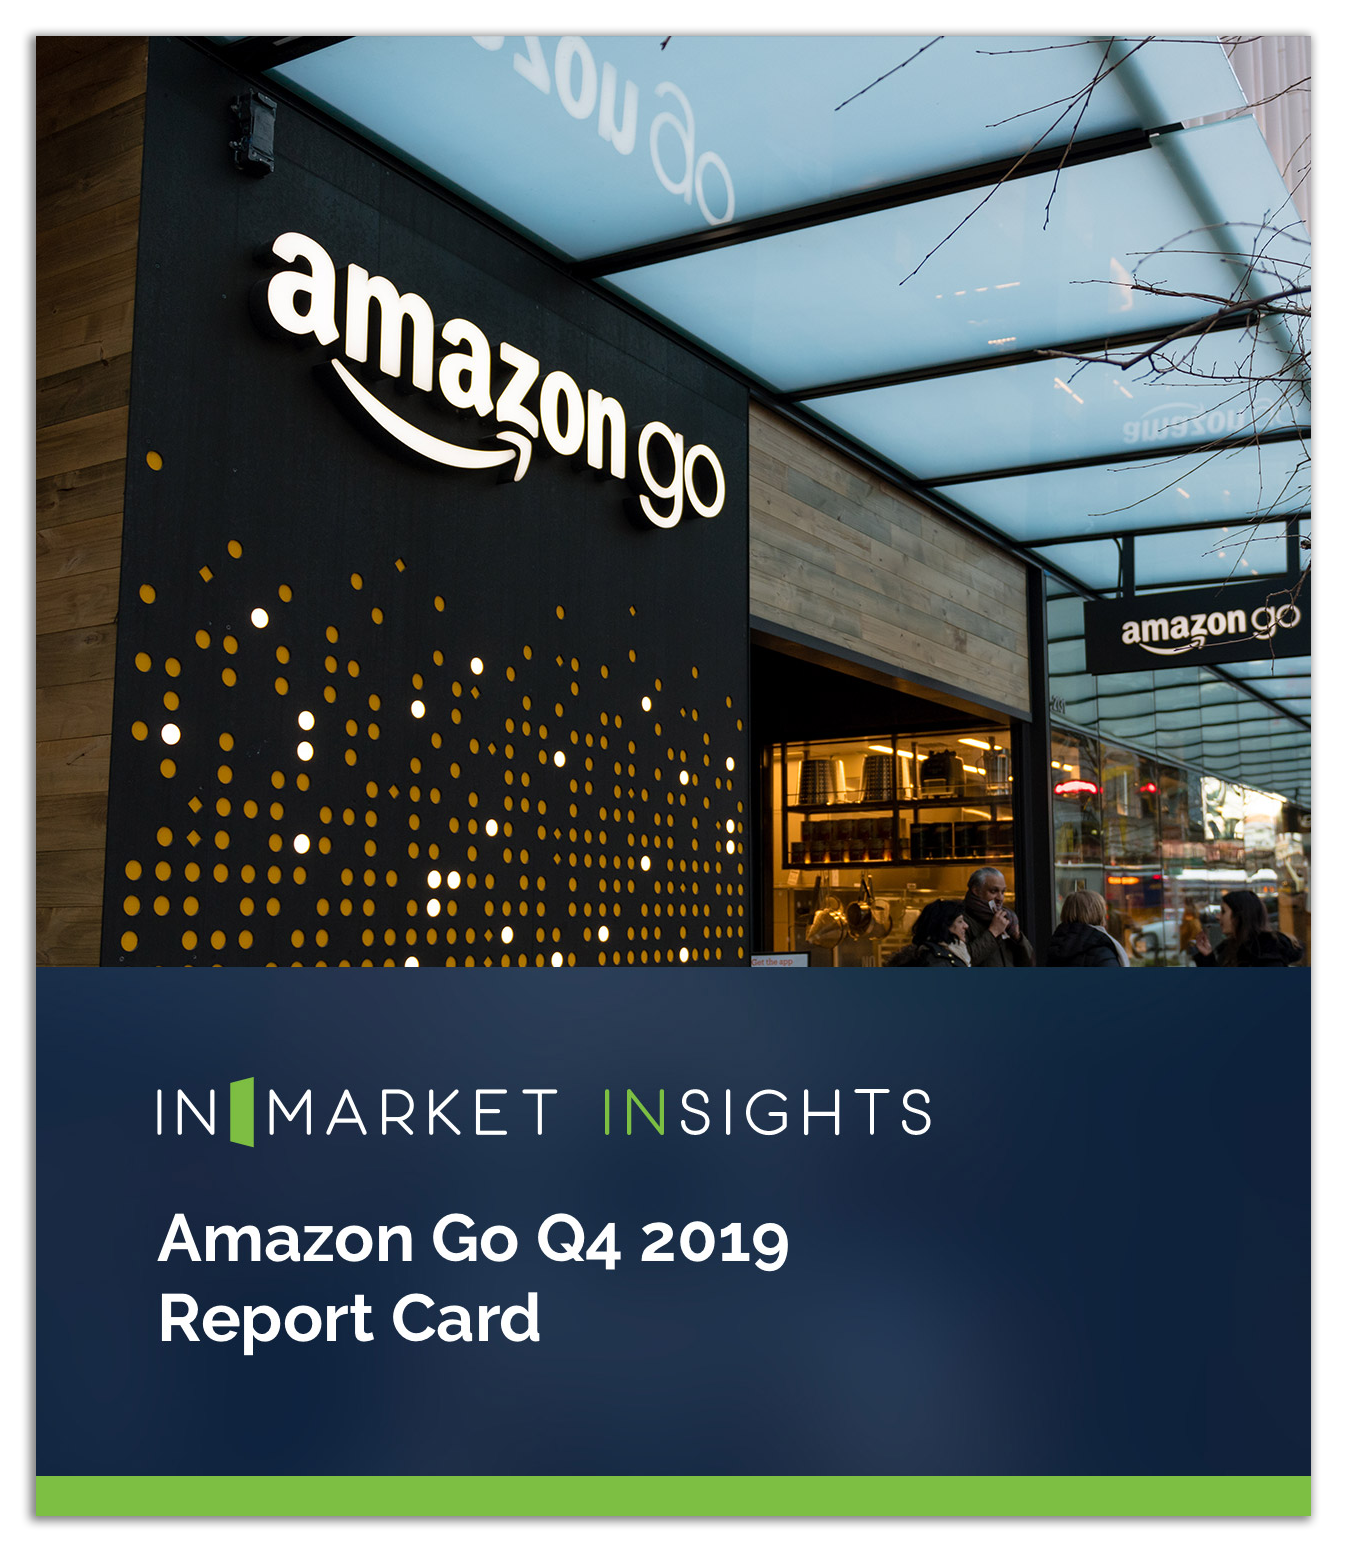
InMarket InSights Amazon Go Q4 2019 Report Card
In this InMarket InSights Report, we’ve used permission-based, first-party, SDK-derived location data from over 50 million Comscore-verified active users to analyze foot traffic patterns and historical data. We’re seeing how Amazon Go visitation patterns stack up against comparable categories as well as changes in visits over time. We looked at Amazon Go shoppers in Q4 2019 in comparison to Convenience, QSRs, and Grocery categories, and then and then analyzed this group’s foot traffic by day of week, and then visits by hour. |
Download Report Below! × |
|---|
InMarket InSights COVID-19 QSRs Impact Report
COVID-19 has impacted every aspect of daily life—the way we travel, shop, work, and most importantly, eat. As a result of nationwide stay-at-home orders, restaurants in particular have been forced to adjust quickly to this new reality. Compounding the pressure on QSRs specifically is the strong association between sporting events and game day traditions be it pizza or wings. In fact, Yahoo recently reported a massive chicken wing surplus due to COVID-19 and the cancellation of the NCAA tournament—one of two events, including the Superbowl, correlated with a spike in chicken wing sales. QSRs are also generally key sponsors of major league sports and often launch relevant tie-in promotions. The cancellation and/or suspension of major sporting events has increased pressure on brands to act quickly and problem-solve creatively. Quick service restaurants have aggressively hit the airwaves highlighting “contactless services” and promoting drive-thru, takeout, pickup and delivery. While all restaurant visits are down around the country, we uncovered which QSRs in particular are faring during these uncertain times. |
Download Report Below! × |
|---|
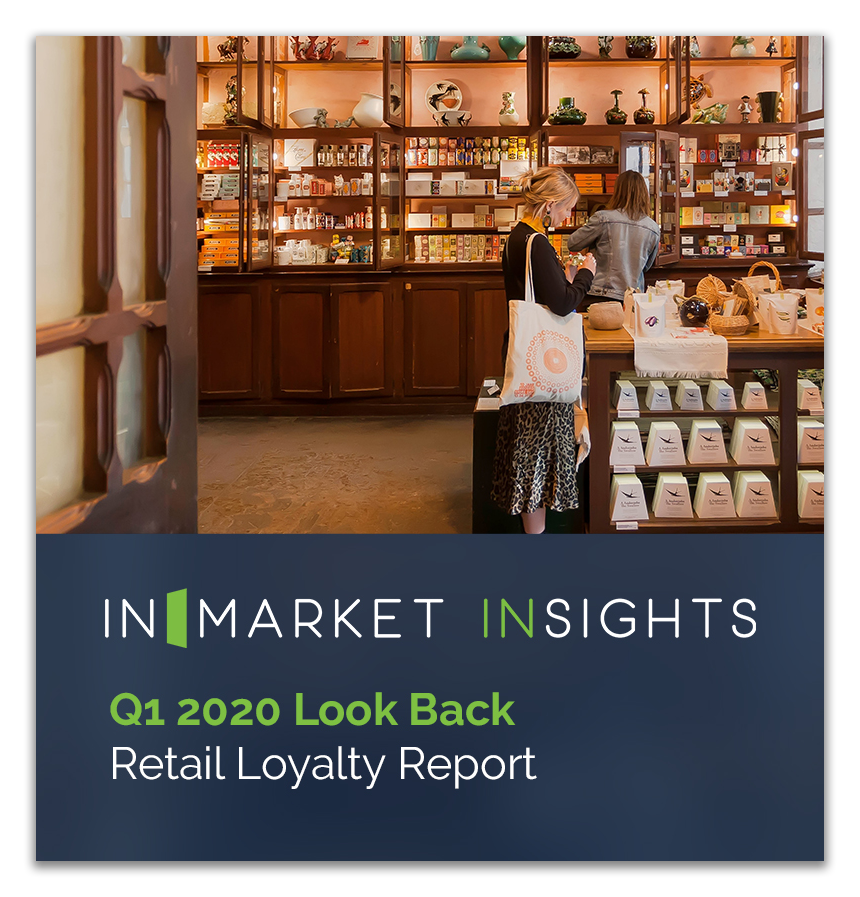
InMarket InSights Q1 2020 Retail Loyalty Report
In this InMarket InSights Report, we’ve used first-party, SDK-verified location data of over 50 million Comscore-verified active users to analyze foot traffic patterns, visitation history--including frequency and dwell time--and real world trends to show the biggest winners and losers. If you’re interested in how these loyalty index scores shake out across other categories, download the report! |
Download Report Below! × |
|---|
InMarket InSights DMAs at Risk of Losing GAP
America’s malls are struggling due to evolving consumer behavior and declining visitation, forcing many retailers with mall-centric footprints to make changes: experimenting with business strategies in-store, restructuring finances, and shifting to data-driven, multi-channel strategies and services to keep up. Gap is making huge changes in order to stay in-step with the American consumer despite financial hurdles. In fact, prior to the COVID-19 pandemic, the clothing retailer announced that they’d be splitting the company in two and closing 230 stores in 2020. Additionally, Gap executives doubled-down on providing a truly frictionless shopping experience across in-store and digital. In order to understand Gap’s downsizing strategy, we’ve compared all of the DMAs in which it has locations in order to predict which areas are likely to have store closures. |
Download Report Below! × |
|---|
InMarket InSights Covid-19 When to Shop and
In this brief, InMarket analyzed visitation data by hour to identify ideal times for consumers to visit grocery and big box retailers. Our analysis also includes how long consumers spent shopping during a visit, and how other considerations such as dedicated hours for “at-risk” shoppers and supply challenges may play a role in determining the best times for consumers to shop. |
Download Report Below! × |
|---|
InMarket InSights Covid-19 Consumer and Shopping Behavior
As the leader in 360 intelligence and real-time activation, InMarket has observed how consumer patterns have been impacted by the outbreak, from purchase patterns to changes in trips to and from their homes. In this brief, we observed and analyzed purchase behavior seen through credit card/debit card transactions and sales data collected from our panel to examine what consumers purchased, and when, against this rapidly unfolding crisis. |
Download Report Below! × |
|---|
InMarket inSights 360 Analysis Whole Foods
To drive higher foot traffic volume and loyalty, Whole Foods -- with the backing of Ecommerce giant Amazon -- has successfully reshaped their online-to-offline strategies and fine tuned their omnichannel initiatives. In order to help marketers understand the impact of these changes, InMarket has been measuring foot traffic patterns of consumers, both in and out of their locations. Observing these real-time movements is crucial, not only because it provides an in-depth dimension of visibility into Amazon’s blueprints for success, but ultimately helps predict outcomes for this mega grocer. |
Download Report Below! × |
|---|
inMarket inSights Q4 2019 P2PI Snapshots
Compares the dwell time and trip frequency (loyalty index) of top retailers in the quarterly reports analyzing consumer visitation patterns for the top retailers in the U.S. |
Download Report Below! × |
|---|