Where Vegetarian-Leaning Consumers Grub & Grocery Shop

July 17, 2019 / by inMarket

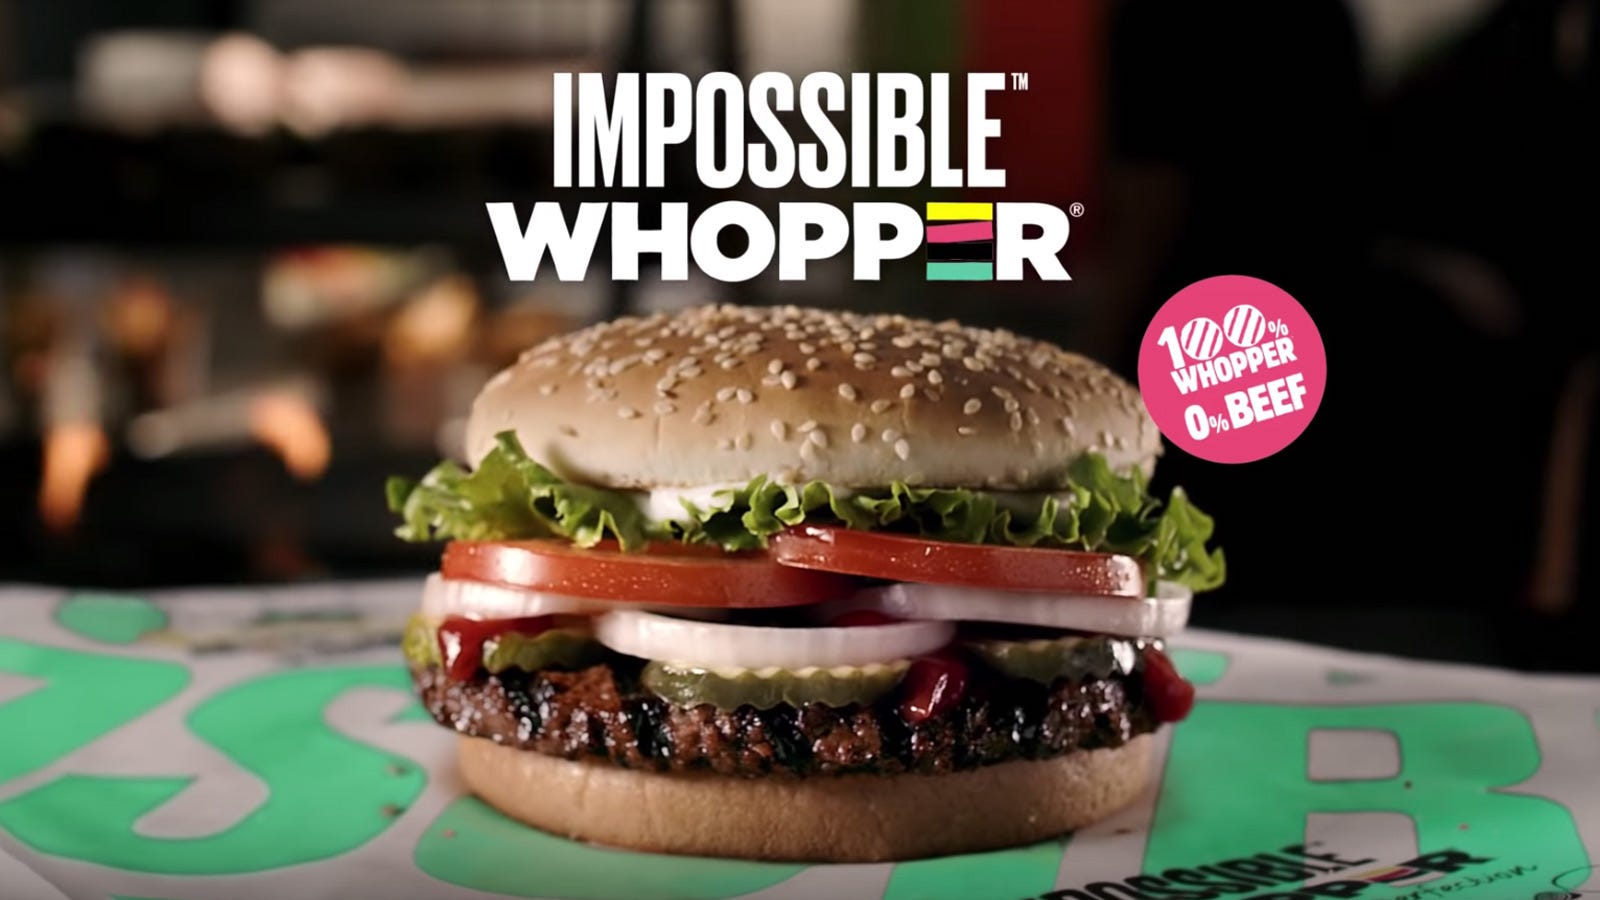
In this updated report on Vegetarian-Leaning Consumers, as more consumers increasingly demand healthier alternatives, it’s clear that consumer preferences are evolving quickly with the announcement of Beyond Meat’s IPO and Burger King rolling out Impossible Whoppersnationwide. By analyzing real-time foot traffic patterns from millions of opted-in U.S. consumers, we are able to gain a granular and actionable perspective on changing grocery and QSR/fast casual trends, and guide marketers to connect with relevant audiences as trends shift.

Get the full results for this deep-dive report on Where Vegetarian-Leaning Consumers Grub & Grocery Shop — now available here.

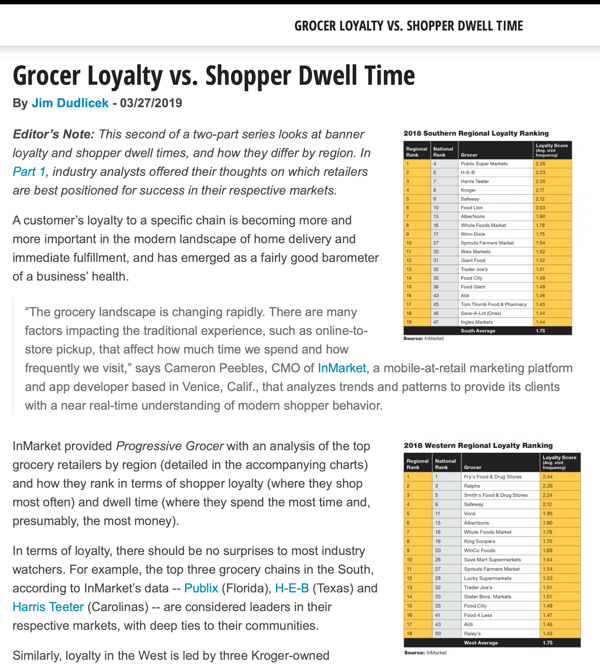
Specialty Grocers Outpace Mainstream Grocers

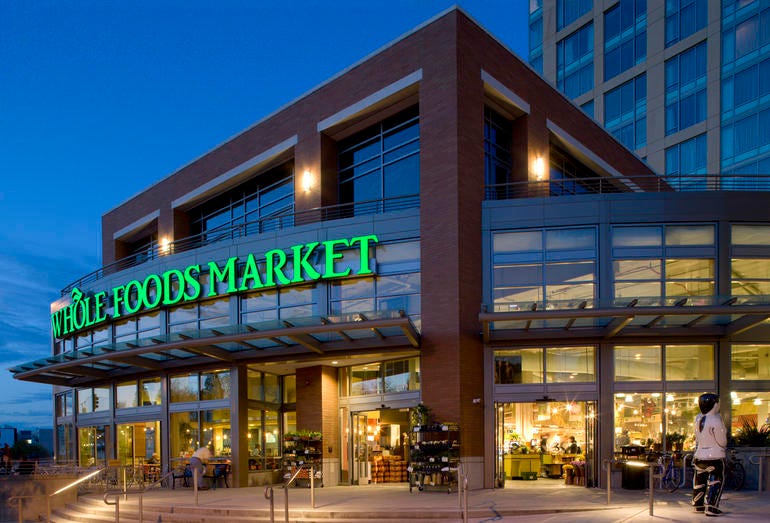
Specialty grocers like Whole Foods, Trader Joe’s, and Sprouts have outpaced mainstream grocers, likely due to the fact that they offer a much more diverse array of vegetarian options than their mainstream counterparts as demand for meat alternatives increases. These specialty grocers also have historically focused on specialty food items like alternative healthier food items and vegetarian offerings — which makes the top 3 grocery chains appealing to vegetarian-leaning shoppers.

Traditional Grocers Included in Majority of Top Choices

While the top 3 are made up of specialty grocers, a majority of the top 10 also include more traditional grocery chains. While vegetarian-leaning consumers over-index at specialty grocers, mainstream grocers are still appealing to this audience as they have expanded their vegetarian options to stay competitive — the convenience of being able to buy specialty items without taking an extra trip to a specialty grocer is an attractive selling point to consumers.

Top Choices of QSRs/Fast Casual Eateries Test Meatless Options

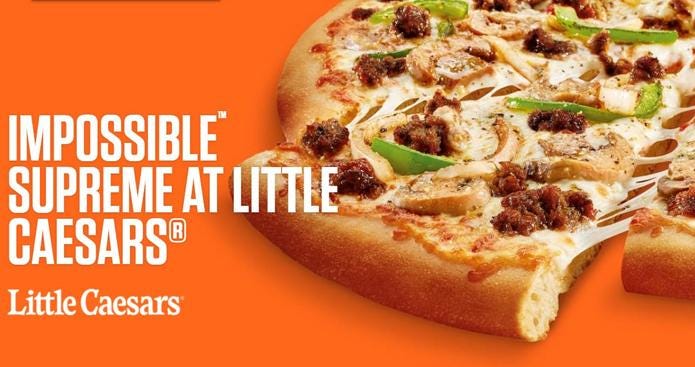
Little Caesar’s, which sits at #8 on the list, is currently testing the Impossible Supreme pizza which features the animal protein substitute from Impossible Foods, further cementing the trend towards meatless options. Also included are fast food Mexican joints, which is also makes sense considering Del Taco recently released their new meatless menu item, Beyond Tacos.

Pizza Rules Other Food Categories

3 of the top 5 restaurants that meat alternative buyers go to are pizza joints. Pizza chains are most popular among customers who purchase meat alternative products, likely because a plain cheese pizza or a veggie supreme is, of course, vegetarian. MOD Pizza, one of the highest ranking fast casual eateries for vegetarian-leaning customers, also happens to be one of the most-funded, having raised more than $312 million thus far.

Sandwich & Mexican Joints Would Benefit from Introducing Meatless Alternative Items

Interestingly, we have three major sandwich chains and two Mexican food chains that over- index with vegetarian-leaning customers, which makes both categories a likely place for expansion of Impossible products.

How We Did It

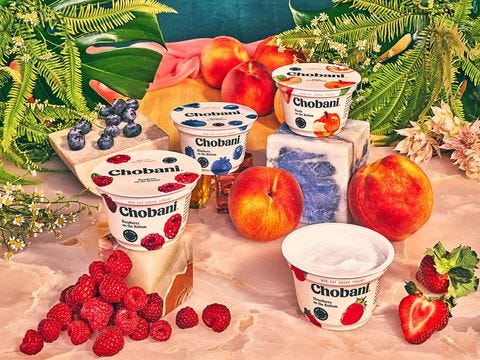
inMarket used first-party, SDK-derived location data of over 50 million Comscore-verified active users to first identify vegetarian-leaning consumers based on which meat alternative brands they’ve purchased, then analyzed their visitation patterns to rank the grocers and eateries this group over-indexes.

So What? Why Should I Care?

Next to using a crystal ball, observing foot traffic patterns is one of the best predictors for consumer behavior, grocery, and fast food chain strategy. Measuring these real-time movements is crucial because it provides an extra dimension of observation and early visibility into how new menu offerings might affect the direction in which the QSR/fast casual industry will move.

Get the full results for this deep-dive report on Where Vegetarian-Leaning Consumers Grub & Grocery Shop — now available here.


Want more inSights reports? Sign up at go.inmarket.com/subscribe or check out inmarket.com/insights.

To learn how your brand can connect with consumers on key milestone days, contact us today.

Check out our other articles:

Read More

Top Restaurants and Retail Chains That Will Win Big This Father’s Day

June 13, 2019 / by inMarket


While Mother’s Day is revered as one of the biggest spending days of the year, Father’s Day is a more modest but growing market. Spending on Father’s Day in the U.S. has grown 70% (or $6.6 billion) over the past decade, and shoppers are expected to spend a record high of $16 billion for dads nationwide. As this day for dad increasingly becomes a bigger spending holiday, inMarket’s first-party SDK derived location data has predicted the restaurant and retail chains that will receive the biggest boosts in consumer traffic this Father’s Day.

Get the full results for this deep-dive report on Father’s Day — now available here.

Restaurant Winners


Dads really like their meat. Eight of the top twenty restaurants are comprised of steakhouses and BBQ chains, suggesting that wherever the ribs or steaks are, families will be there as well (be sure to bring wipes).

  • There’s a definite type of ambiance that dads are attracted to on Father’s Day — families are predicted to keep meals casual this year. While all restaurants anticipate a boost in foot traffic due to this holiday, upscale restaurants like Morton’s Steakhouse and The Capital Grille see much smaller increases in foot traffic than casual chains like Texas Roadhouse.
  • Pizza joints like Simple Simon’s Pizza and Anthony’s Coal Fired Pizza see an increase in foot traffic, but are not expected to be a top choiceamongst those celebrating Father’s Day.

Retail Chain Winners

  • Amongst the top ten chains with highest increase in foot traffic, movie theaters are expected to see higher foot traffic. While blockbuster films like Incredibles 2 and Ocean’s 8 caused visitations to spike in 2018, new hits like The Secret Life of Pets 2 and Men in Black: International will also likely drive families into theaters on Father’s Day.
  • Almost half of the top twenty chains, comprised of Outdoor and Sporting Goods chains, are predicted to see higher than average foot traffic. Want to make dad happy this year? Get him a new tackle box or new golf clubs.
  • While two auto chains, Fix Auto Worldwide and Gerber Collision, are included amongst the top 20, they are the exception as a majority of auto chains are expected to see a drop in foot traffic.
  • Surprisingly, while tools and home maintenance are typical “dad” interests, hardware and home improvement chains like The Home Depot and Lowe’s are expected to see a significant decrease during Father’s Day.

How We Did It

inMarket combined years of precise location data and AI to predict the big winners based on their visitation frequency growth on Father’s Day. We first aggregated each location’s average traffic prior to Father’s Day, then observed how much visits increased on Father’s Day, and finally ranked each location by percent of visit growth from highest to lowest.

So What? Why Should I Care?

Next to using a crystal ball, observing foot traffic patterns is one of the best predictors for consumer behaviors and holiday trends.Get the full results for this deep-dive report on Father’s Day — now available here.


Want more inSights reports? Sign up at go.inmarket.com/subscribe or check out inmarket.com/insights.

To learn how your brand can connect with consumers on key milestone days, contact us today.

Check out our other articles:


Read More

How Did Burger King’s Market Test for Impossible Whoppers Perform?

May 29, 2019 / by Brandon Lane

How Did Burger King’s Market Test for Impossible Whoppers Perform?

Burger King made big headlines on April 1, 2019 when it announced it would be testing The Impossible Whopper — which features an entirely meatless patty created by plantbased food producer, Impossible Foods — in the St. Louis market. Its release wasn’t an elaborate prank by Burger King, but rather, a calculated move that followed increasing demand of consumers who want a wider variety of healthier options. Burger King is planning on expanding this menu offering nationwide by the end of the year, so we’ve analyzed visitation patterns to provide insight on how Impossible Whoppers impacted the test market, and how it may affect this fast food chain nationwide as well.
 
Download Report

This inMarket inSights Report Card Is Featured In:


Download The Report Below!

Download the Report Now!

Learn More About Converting Consumers Throughout These Verticals


Contact Us

inMarket 1350 Abbot Kinney Blvd 101 Venice CA 90291

Read More

How Successful Were Impossible Whoppers in Burger King’s Test Markets?

May 22, 2019 / by inMarket

Credit: Burger King

Burger King made big headlines when it announced it would be testing The Impossible Whopper — featuring an entirely meatless patty created by plant-based food producer, Impossible Foods — in the St. Louis market. Burger King is expanding this menu offering nationwide, so we’ve analyzed visitation patterns to show the impact of the Impossible Whopper’s launch on test markets, and how it may affect this fast food chain nationwide as well.

Get the full results for this deep-dive report on Impossible Whoppers — now available here.

  • Overall, Burger King locations selling the Impossible Whopper outperformed the chain’s U.S. foot traffic average by 18.5% during the test period.
  • During the month of the Impossible Whopper’s release, St. Louis Burger King locations attracted 16.75% higher foot traffic than the previous month’s average.
  • Burger King locations that did not roll out Impossible Whoppers saw a slight decrease in visits. Nationally outside of St. Louis, foot traffic was 1.75% lower during the Impossible Whopper’s test period, compared to the previous month’s average.
  • It’s likely that this massive boost in foot traffic is due in large part to the fast food chain’s new meatless option. Given the success in St. Louis, we expect to see a positive impact on visitation as the Impossible Whopper rolls out nationally in the future.

How We Did It

inMarket’s first-party, SDK-derived location data of over 50 million Comscore-verified active users to analyze visitation spikes and dips for Burger King locations selling the Impossible Whopper in St. Louis and compared it to nationwide Burger King locations who did not sell the Impossible Whopper.

So What? Why Should I Care?

Next to using a crystal ball, observing foot traffic patterns is one of the best predictors for consumer behavior, fast food chain strategy and growth. Measuring these real-time movements is crucial because it provides an extra dimension of observation and early visibility into how new menu offerings might affect the direction in which the fast food industry will move.


Get the full results for this deep-dive report on Impossible Whoppers — now available here.

Want more inSights reports? Sign up at go.inmarket.com/subscribe or check out inmarket.com/insights.

To learn how your brand can connect with consumers on key milestone days, contact us today.

Check out our other articles:

Read More

360-Degree Analysis: Whole Foods, Spring 2019

May 16, 2019 / by Brandon Lane


360-Degree Analysis:
Whole Foods, Spring 2019

Since acquiring Whole Foods in August of 2017, Amazon has made substantial changes to the chain, including adding pickup and drop-off lockers to many locations and extending discounts to Amazon Prime Members. inMarket has previously released several inSights reports on their changing foot traffic patterns, however, we are now able to deliver a comprehensive, year-over-year analysis in order to see the effects that these changes have made.
 
Download the Report Now!

This Report Is Featured In:


 Download the Report Below!

Download the Report Now!

Learn More About Converting Customers Throughout These Verticals

 
CPG Icon (1)
Retail Icon
 
Contact Us

inMarket 1350 Abbot Kinney Blvd 101 Venice CA 90291

Read More

Amazon’s Effect on Whole Foods Shopper Behaviors

May 16, 2019 / by inMarket

Since Amazon’s acquisition of Whole Foods in 2017, this natural-leaning grocer has seen numerous changes from the introduction of Amazon Lockers to the addition of Amazon Prime benefits. And as Amazon continues to evolve their strategy for Whole Foods, inMarket has used first-party, SDK derived always-on location data to observe visitation habits, frequency, dwell time, and purchasing trends to help marketers understand Amazon’s impact on this chain.

Get the full results for this deep-dive report on Whole Foods 360-Degree inSights— now available here.

Foot Traffic

Whole Foods brought in higher foot traffic in Q1 2019 than compared to the same time period last year. Amazon seems to be focused on inspiring visits from their customers by incentivizing their 100 million Prime membership holders with special perks and doubling down on their digital omnichannel strategy. This may also indicate that shoppers are visiting more frequently than the previous year.

New Shoppers

The number of new shoppers at Whole Foods has decreased from Q1 2018. While 2018 was a strong year for bringing in new shoppers, Whole Foods has slowed down on this strategy, and is instead focusing on developing plans to retain current shoppers.

Micro Visits

There was a substantial increase in micro visits in 2019, which may be due to the increased rate of additional Amazon Lockers and streamlined online order pickups for quick in-and-out trips.

Dwell Time

Shoppers who enter Whole Foods locations are spending less time there. This may be a small byproduct of the increased micro visits on average dwell time — shoppers who are just above the 5 minute threshold for micro visits might be affecting the average dwell time.

Brand Volume Growth

Interestingly, brands for pantry or dry packaged foods — like granola bars or cereal — were not among the top 5. Whole Foods shoppers are buying brands which largely focus on perishable and/or refrigerated items — confirming that consumers demand a fresh, healthy selection of food.

How We Did It

inMarket’s first-party, SDK derived location insights platform measured foot traffic spikes and dips around key days for non-grocery retailers using 50 million Comscore-verified monthly active users.

So What? Why Should I Care?

Next to using a crystal ball, observing foot traffic patterns is one of the best predictors for consumer behavior, grocery chain strategy and growth. Measuring these real-time movements is crucial because it provides an extra dimension of observation and visibility into Amazon’s master plan, and predicts the direction in which the grocery industry will move.


Get the full results for this deep-dive report on Whole Foods — now available here.
Want more inSights reports? Sign up at go.inmarket.com/subscribe or check out inmarket.com/insights.

To learn how your brand can connect with consumers on key milestone days, contact us today.

Check out our other articles:

Read More

inMarket Predicts the Big Winners on Mother’s Day

May 9, 2019 / by inMarket

Photo by Chema Photo on Unsplash

Everyone loves mom — and it’s not just because moms are awesome (they do make the best home cooked dinners or know how to cheer you up when you’re down). Mother’s Day is one of the biggest spending days of the year, and that means huge opportunities for brands to drive revenue.

inMarket has analyzed multiple years of our SDK derived, always-on, precise location data with advanced AI algorithms in order to predict the big winners in visitation increase this Mothers Day.

Get the full results for this deep-dive report on Mother’s Day — now available here.
Restaurant Winners


Upscale restaurants are expected to see higher foot traffic on Mother’s Day.

  • The top 4 group includes upscale restaurants, as families will likely show their appreciation for mom by wining and dining her at a fancy restaurant.
  • Kona Grill, which filed for bankruptcy in April 2019, is among the top 5 restaurants to see foot traffic higher than its typical average. Mothers Day is expected to provide this restaurant a much needed boost.
  • Several well known casual dining chains are predicted to be popular as well, suggesting that a more relaxed, kid-friendly environment appeals to other families.
  • While restaurants are predicted to be popular, ice cream chains like Ben & Jerry’s and Carvel are also expected to see higher than normal traffic. Whether after an upscale steak dinner, or a belt-loosening buffet, Mothers Day celebrators will always leave room for dessert.
  • Interestingly, although Mothers Day is widely known as a brunch or breakfast holiday, chains like Denny’s (-8.31%) or Waffle House (-10.78%) are expected to see lower foot traffic.

Retail Chain Winners


Mother’s day isn’t just for mom when it comes to retail.

  • Although foot traffic increases significantly at obvious “mom” retailers (like Ann Taylor), there are also increases for several children’s and teen-centric chains (like LEGO and Hollister) as well. Mothers Day isn’t just about mom — in this case, it’s about the family. Mothers Day is a reason for families to get together, and the data predicts that families will browse stores together.
  • Many chains that see lower than average foot traffic are places moms traditionally need to go: non-luxury Household Goods chains like Bed Bath & Beyond (-6.57%) and craft stores like Michaels (-8.05%) will see a drop on this holiday. These chains are frequent “mom” destinations, so families take her elsewhere on Mothers Day.

How We Did It

inMarket combined years of precise location data and AI to predict the big winners based on their visitation frequency growth on Mother’s Day. We first aggregated each location or category’s average traffic prior to Mother’s Day, then observed how much visits increased on Mother’s Day, and finally ranked each location by percent of visit growth from highest to lowest.

So What? Why Should I Care?

Next to using a crystal ball, observing foot traffic patterns is one of the best predictors for trends.

Get the full results for this deep-dive report on Mother’s Day — now available here.
Want more inSights reports? Sign up at go.inmarket.com/subscribe or check out inmarket.com/insights.


To learn how your brand can connect with consumers on key milestone days, contact us today.

Check out our other articles:

Read More

Key Days to Market in the Summer

April 22, 2019 / by inMarket

We get it — summer can sometimes be slow for retailers that focus heavily on the winter holidays. For those stuck in the summer slump, we uncovered key dates that are being underutilized to help brands connect with consumers. Take a look!

Slurpee Day


Mmmm, taste that sweet refuge from the summer heat.Who doesn’t love a frosty cold treat for FREE on a hot summer day? Slurpee Day, celebrated every year on July 11th (7/11), is also the 2nd busiest time during the summer months for convenience stores. This unofficial holiday may be the reason people are rushing into convenience stores while other retail categories were down. Brands have a unique opportunity to reach consumers at C-stores this year on Thursday, 7/11/2019.

Lunar & Solar Eclipses


2018 was a big year for astrological events:

Lunar Eclipse

  • Higher foot traffic than usual across all categories except drug stores
  • Notably higher than average foot traffic at convenience store

Solar Eclipse

  • Higher than usual foot traffic across all categories except drug stores
  • 2nd busiest day for department stores

Astrological milestones are a unique and underutilized opportunity for marketers to connect with consumers as they gear up to observe the heavens. Plan around the upcoming lunar eclipse on 7/16/2019. Marketers will unfortunately have to wait until 2024 for the next visible solar eclipse in the U.S.

NOT Labor Day


Labor Day is an obvious date for marketers to note in their calendars, but the day of the actual holiday sees a significant drop in foot traffic. Department stores are busiest on the Saturday during the long weekend before the actual holiday, so marketers should focus on advertising on the days leading up as consumers are shopping early and relaxing the day of Labor Day.

How We Did It

inMarket’s first-party, SDK derived location insights platform measured foot traffic spikes and dips around key days for non-grocery retailers using 50 million Comscore-verified monthly active users.

So What? Why Should I Care?

Next to using a crystal ball, observing foot traffic patterns is one of the best predictors for seasonal trends.

Get the full results for this deep-dive report on Q3 2019 Foot Traffic — now available here.


Want more inSights reports? Sign up at go.inmarket.com/subscribe or check out inmarket.com/insights.

To learn how your brand can connect with consumers on key milestone days, contact us today.

Check out our other articles:

Read More

Report Card: Kombucha Drinkers

April 15, 2019 / by Brandon Lane

Report Card: Kombucha Drinkers

We’ve heard the stereotype for kombucha drinkers: health-conscious yogis who exclusively consume all organic produce — but this picture couldn’t be further from reality. Thanks to inMarket’s first-party, SDK derived location data, we’ve taken a refreshing perspective on the
purchasing behaviors of kombucha drinkers, and have also confirmed a very different consumer
profile that might surprise you.
 
In this inMarket inSights Report Card, we’ve ranked the top and bottom ten grocery chains based on Kombucha Drinkers visitation frequency patterns. What emerged is a clear list of winners and losers, and wild cards that would surprise astute industry analysts.
 
Download the latest inMarket inSights Report Card to find out the results!
 
Download Report

inMarket inSights have been featured in:

CNBC_logo.svg.png
WSJ_logo.png
USA_01-2000x1333-1.jpg


Download The Report Below!

Download Report!

Learn More About Influencing the
Shopper Lifecycle

email-anim
Contact Us

inMarket 1350 Abbot Kinney Blvd 101 Venice CA 90291

Read More

Progressive Grocer Partners with inMarket to Explore Grocer Loyalty VS Shopper Dwell Time

April 10, 2019 / by Brandon Lane


Progressive Grocer Partners with inMarket to Explore Grocer Loyalty VS Shopper Dwell Time

The same industry leading 1st party location data that enables us to profile, reach and connect our 50 MM unique comScore verified US consumers with savvy brands also enables us to partner with the world's leading publications in order to shed light on current industry headlines. Recently, Progressive Grocer and inMarket teamed up to further explore Grocer Loyalty vs Shopper Dwell Time. Check out their exclusive report below:

This inSights Report was
exclusively featured in:

Continue Reading On ProgressiveGrocer.com


Learn More About Influencing the
Shopper Lifecycle

email-anim
Contact Us

inMarket 85 Broad Street 18th Floor New York NY 10004

Read More

Subscribe to Email Updates

Recent Posts