inMarket inSights Burger King Impossible Burger Report Card
Burger King made big headlines when it announced it would be testing The Impossible Whopper — featuring an entirely meatless patty created by plant-based food producer, Impossible Foods — in the St. Louis market. Burger King is expanding this menu offering nationwide, so we’ve analyzed visitation patterns to show the impact of the Impossible Whopper’s launch on test markets, and how it may affect this fast food chain nationwide as well. Check out the report to see the results! |
Download Report Below! × |
|---|
inMarket inSights 360-Degrees Analysis: Whole Foods, Spring 2019
Since Amazon’s acquisition of Whole Foods in 2017, this natural-leaning grocer has seen numerous changes from the introduction of Amazon Lockers to the addition of Amazon Prime benefits. And as Amazon continues to evolve their strategy for Whole Foods, inMarket has used first-party, SDK derived always-on location data to observe visitation habits, frequency, dwell time, and purchasing trends to help marketers understand Amazon’s impact on this chain. Check out the report to see the results! |
Download Report Below! × |
|---|
inMarket inSights P2Pi Q1 2019 Snapshots
Compares the dwell time and trip frequency (loyalty index) of top retailers in the first of what will be quarterly reports analyzing consumer visitation patterns for the top retailers in the U.S. Check out the first P2Pi report to see the results! |
Download Report Below! × |
|---|
inMarket inSights Mother's Day 2019 Foot Traffic Predictions
Everyone loves mom, and not just because moms make the best home cooked dinners or know how to cheer you up when you’re down -- Mothers Day is one of the biggest spending days of the year, and that means huge opportunities for brands to drive revenue. Mothers Day spending is expected to reach a record high of $25 billion this year, and thanks to inMarket’s first-party SDK derived location data, we’ve predicted the restaurant and retail chains that will receive the largest bumps in consumer traffic this Mothers Day. Download the latest inMarket inSight to see the results! |
Download Report Below! × |
|---|
inMarket inSights Q3 2019 Foot Traffic Predictions
Summer planning extends beyond Independence Day and Labor Day weekend -- In this Q3 2019 report, we're using first-party location data from 50 million monthly smartphone owners to map the months during summer, and have surfaced key opportunities for brands from July to September. Download the latest inMarket inSight to see the results! |
Download Report Below! × |
|---|
inMarket inSights Q2 2019 Foot Traffic Predictions
Spring means warm weather, new growth, outdoor events, and more. With the thaw in full effect, where are shoppers going? In this Q2 2019 report, we're using first-party location data from 50 million monthly smartphone owners to map the months of spring. Download the latest inMarket inSight to see the results! |
Download Report Below! × |
|---|
inMarket inSights Retail Loyalty Report: Winter 2019
From a marketing standpoint, customer retention is cheaper and potentially more lucrative than new customer acquisition. Businesses with high loyalty scores are typically healthier and more efficient than their low-scoring counterparts, as loyalty has historically been an excellent barometer for growth and decline. In this Loyalty Report, we're ranking the top 10 and bottom 10 non-grocery retailers based on customer loyalty from January 1 through February 28, 2019. Download the latest inMarket inSights Report Card to see the results! |
Download Report Below! × |
|---|
inMarket inSights Amazon Goers vs No-Goers
In this inMarket inSights Report Card, we've used first-party, SDK derived location data to rank the top five and bottom five retail chains shoppers frequent when they're not at Amazon Go stores. We've used inMarket's database of over 50 million comScore verified monthly users to identify who are Amazon Goers and Amazon No-Goers, and then analyzed their foot traffic patterns to see where else they shop. Download the latest inMarket inSights Report Card to see where Amazon Goers shop! |
Download Report Below! × |
|---|
inMarket inSights Kombucha Drinkers Report Card
In this inMarket inSights Report Card, we take a deeper dive into where kombucha drinkers shop using 50 million Comscore-verified monthly active users. Download the Report to find out more! |
Download Report Below! × |
|---|
inMarket inSights Q1 2019 Grocery Loyalty Report
In this inMarket inSights Report Card, we rank the 25 grocery chains with the highest customer loyalty indexes using 50 million Comscore-verified monthly active users. Download the Report to find out more! |
Download Report Below! × |
|---|
inMarket inSights Q1 2019 Foot Traffic Report
In this Q1 2019 report, we’re using first-party location data from 50 million monthly smartphone owners to map the first three months of the year.Through the lens of our massive historical data sets, we’ve identified the most important shopping dates based on heaviest foot traffic in each retail category. Download the Report to find out more! |
Download Report Below! × |
|---|
inMarket inSights Toys "R" Us Shoppers: Where are they now?
In this inMarket inSights report, we’ve taken a look at where former Toys "R" Us shoppers have decided to take their business since the closing of the chain. Download the Report to find out more! |
Download Report Below! × |
|---|
inMarket inSights Report Card: Amazon Go
In this inMarket inSights report, we’ve compiled the first-ever look at shopper behavior and visitation trends at Amazon Go stores in Seattle and Chicago. Download the Report to find out more! |
Download Report Below! × |
|---|
inMarket inSights Report Card: Taco Bell Nacho Fries
Social media and blogs were frenzied with news, posting reviews about the product ranging from outstanding to catastrophic. But at inMarket, we’re not here to grade taste. Putting flavor aside, we’re more interested on if and how Nacho Fries are driving customers into Taco Bell restaurants. Through the lens of our first party location data platform, inMarket can provide an exclusive glimpse into the real world movements of consumers at scale. Download the Report to find out more! |
Download Report Below! × |
|---|
inMarket inSights Q4 2018 Foot Traffic Predictions for CPG Brands
In this inMarket inSights Report Card, we took a look through the lens of our massive historical data sets and identified the most important shopping dates based on heaviest foot traffic in each retail category. Through this analysis, we've surfaced key opportunities for brands throughout November and December that normally go unnoticed. Download the Report to find out more! |
Download Report Below! × |
|---|
inMarket inSights Health Supplement Users
In this inMarket inSights Report Card, we took a closer look at where health supplement users shop and dine. Do they stick with their goal of boosting health and vitality or are they only using supplements as an attempt to offset their indulgent restaurant habits? Download the Health Supplement User Report Card to find out! |
Download Report Below! × |
|---|
inMarket inSights Whole Foods
The impact of Amazon on Whole Foods has been felt in a variety of ways. Increased microvisits, increased private label sales, and now... increased 4th of July foot traffic? In this inMarket inSights report, we've examined foot traffic at Whole Foods on Independence Day -- and the data might surprise you. Download the report to see the results! |
Download Report Below! × |
|---|
inMarket inSights Year One Assessment:
Since taking control of Whole Foods, Amazon’s impact has been felt in a variety of ways -- from the addition of lockers for in-store pickup, to the juxtaposition of tech products next to common grocery items. In this inMarket inSights report, we've examined exactly what's changed at Whole Foods since the big acquisition -- from high level visitation habits, to what shoppers are actually buying. Download the report to see the results! |
Download Report Below! × |
|---|
inMarket inSights Vegetarian Leaning Shopper Report
In this inMarket inSights report, we’ve ranked the top five grocery chains based on their attractiveness to vegetarian-leaning consumers, based on a combination of purchase history and visitation patterns. We first identified shoppers who have purchased meat alternatives including Boca Burger, Morning Star, Quorn and Beyond Meat thus far in 2018 — and then analyzed their grocery visitation patterns from January - May, 2018, to uncover where this group over-indexes versus the U.S. baseline. Download the report to see the results! |
Download Report Below! × |
|---|
inMarket inSights Q3 Shopper Traffic Report
Q3 is bookended by two major holidays — Independence Day and Labor Day. In between, the hot summer months play host to a ton of shopping — as families escape the heat for the cool confines of their local mall, or to refresh the wardrobe during back-to-school shopping. We took a closer look at what retailers capatilized on this time period. Download the report to see the results! |
Download Report Below! × |
|---|
inMarket inSights Report Card Restaurant Income
At inMarket, we’re constantly analyzing audience segments based on true consumer behaviors, so we can provide our partner agencies and brands with unmatched intelligence that boosts ad campaign efficiency. One of the largest segmentation categories that our partners ask for is income level — which has historically been a vital guide for brands to reach people who are most receptive to their message. With that in mind, we’ve ranked the 280 largest U.S. quick- and full-service restaurants based on median income level of its customer base. Download the report to see the results! |
Download Report Below! × |
|---|
inMarket inSights Report Card Amazon Lockers
Through the lens of first party location data, we’ve segmented Whole Foods stores across the top 10 DMAs into two buckets — those with Amazon Lockers, and those without — to understand how they’re impacting visitation behaviors. Find out in the report! |
Download Report Below! × |
|---|
inMarket inSights Report Card Dick's Sporting Goods
On 2/28/18, Dick’s Sporting Goods CEO Edward W. Stack announced that the retailer would end sales of assault-style rearms and high capacity magazines, and raise the minimum age to purchase a gun from 18 to 21. The move has been both praised and condemned by Americans on both sides of the issue — with those in favor of the new rules sending owers and donuts, and those opposed threatening to boycott the retailer all together. Has the decision effected foot traffic? Find out in the report! |
Download Report Below! × |
|---|
inMarket inSights Report Card Late Night Dining
In this inMarket inSights Report Card, we’re using inMarket Location Data to take a deeper look into late night dining habits. Download now! |
Download Report Below! × |
|---|
inMarket inSights Q2 Foot Traffic Report: Retail
In this inMarket inSights Report, we’re using inMarket Location Data to take a deeper look into the retail shopping habits that take place during Q2. Download now! |
Download Report Below! × |
|---|
inMarket inSights Foot Traffic Report: Toys R Us
In this inMarket inSights Report, we’re using inMarket Location Data to take a deeper look into foot traffic at Toys R Us. Download now to see the results! |
Download Report Below! × |
|---|
inMarket inSights Report Card: New Year's Resolutions
In this inMarket inSights Report, we’re using inMarket Location Data to take a deeper look into how long people stay with their New Year's Resolutions. Download now to see the results! |
Download Report Below! × |
|---|
inMarket inSights Q1 Foot Traffic Report: Retail
In this inMarket inSights Report, we’re using inMarket Location Data to take a deeper look into the retail shopping habits that take place during Q1. Download now! |
Download Report Below! × |
|---|
inMarket inSights Mapping The Holiday Shopping Season
In this inMarket inSights Report, we’re using inMarket Location Data to map the holiday shopping season and uncover hidden marketing opportunities. Download now to see what you may be missing! |
Download Report Below! × |
|---|
inMarket inSights Report Card: Music Festivals
This three page inMarket inSights Report Card takes a deeper look into foot traffic and attendee income during the 2017 music festival season. |
Download Report Below! × |
|---|
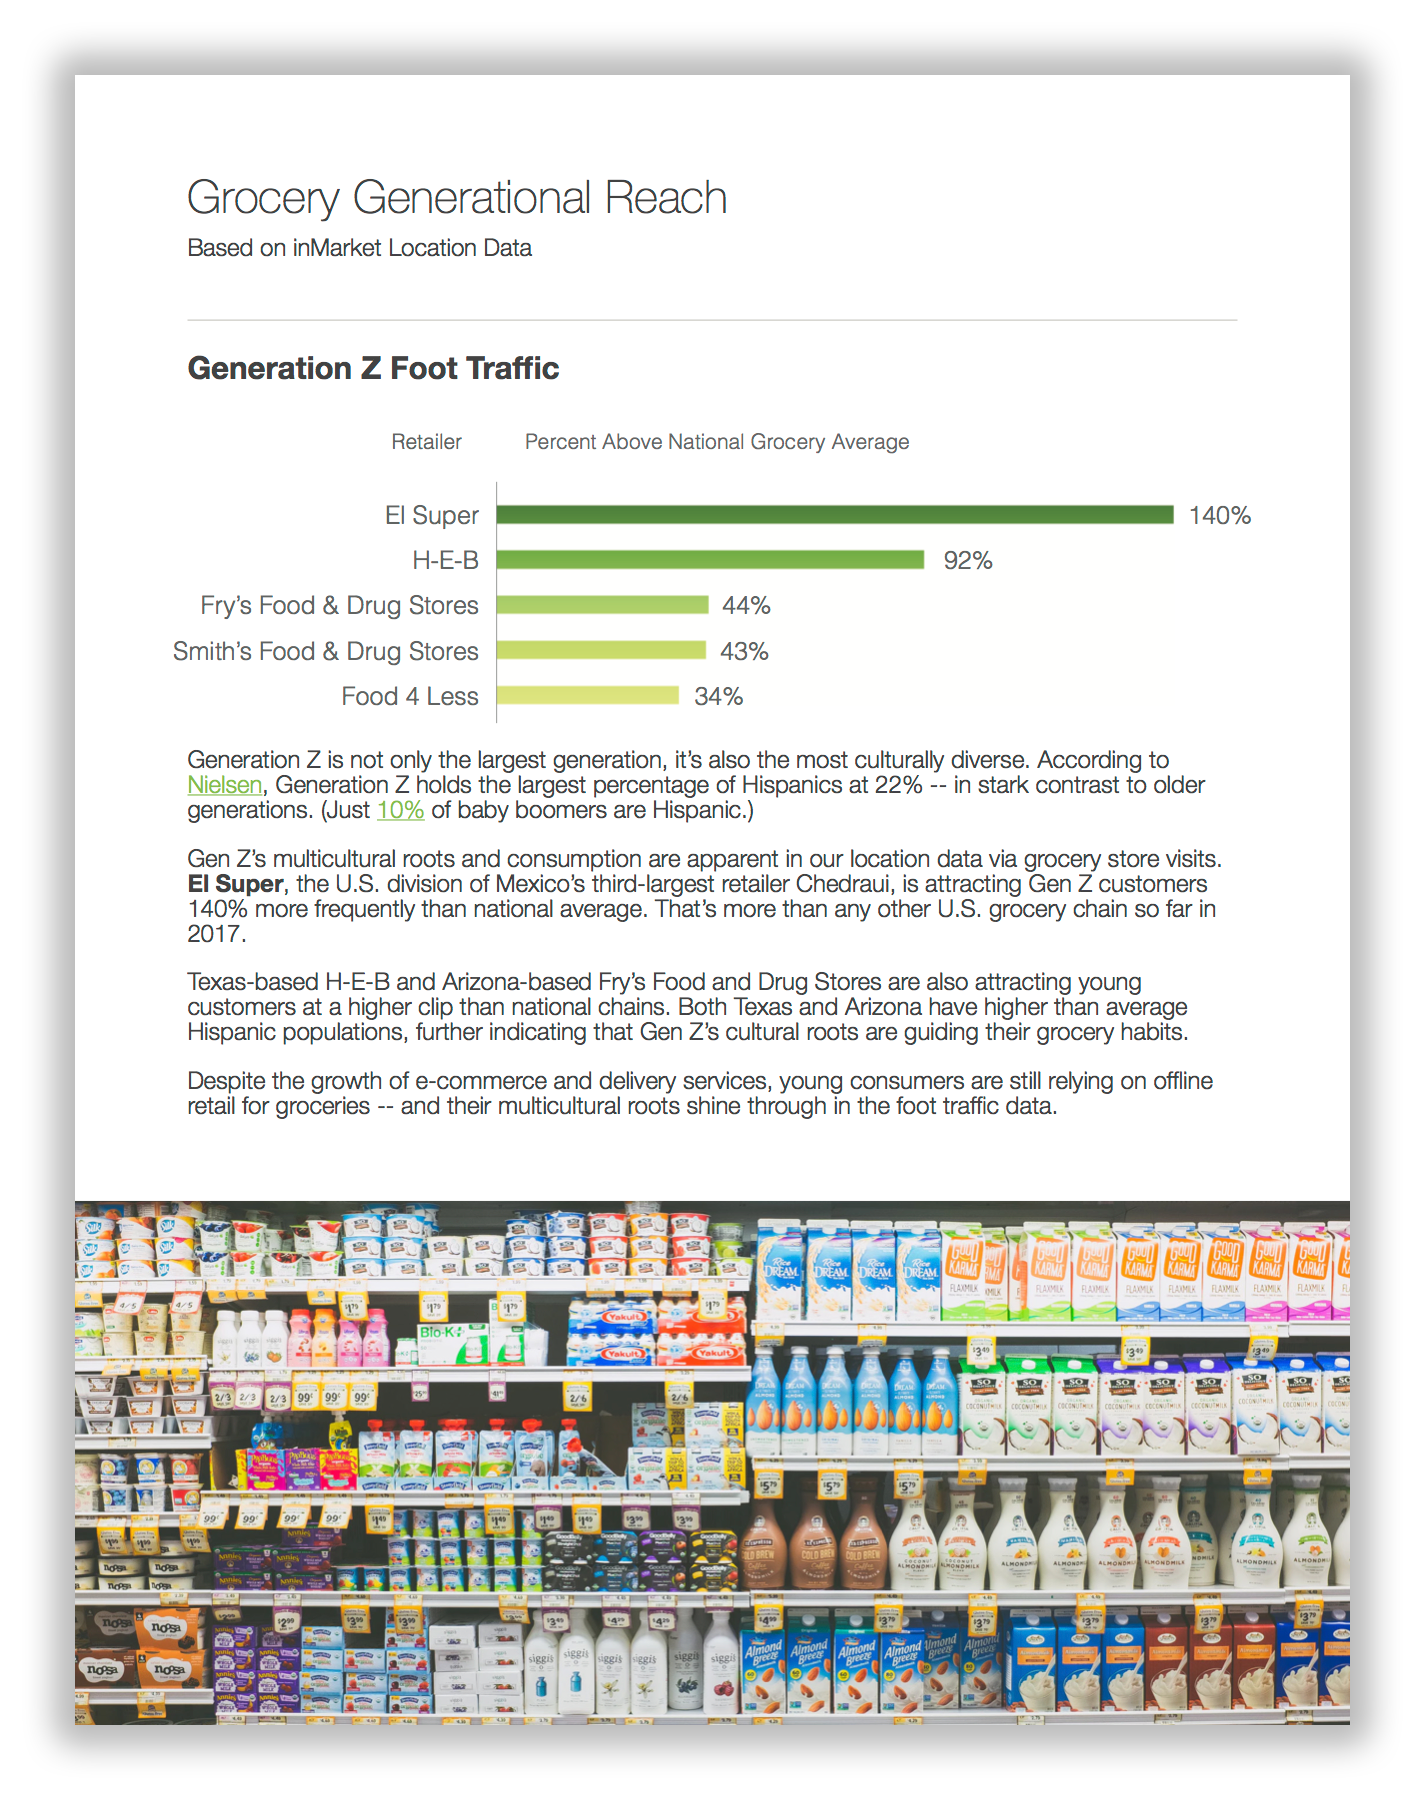
Generational Report Card: Grocery
In our six page generational foot traffic report for grocery, we’re using inMarket Location Data to examine the different grocery shopping habits of each generation. |
Download Report Below! × |
|---|
inMarket inSights Report Card: Lidl
This inMarket inSights Report Card covers Lidl's expansion into the US and its effect on the competition. Download the report to find out if Lidl's expansion into the US has been successful! |
Download Report Below! × |
|---|
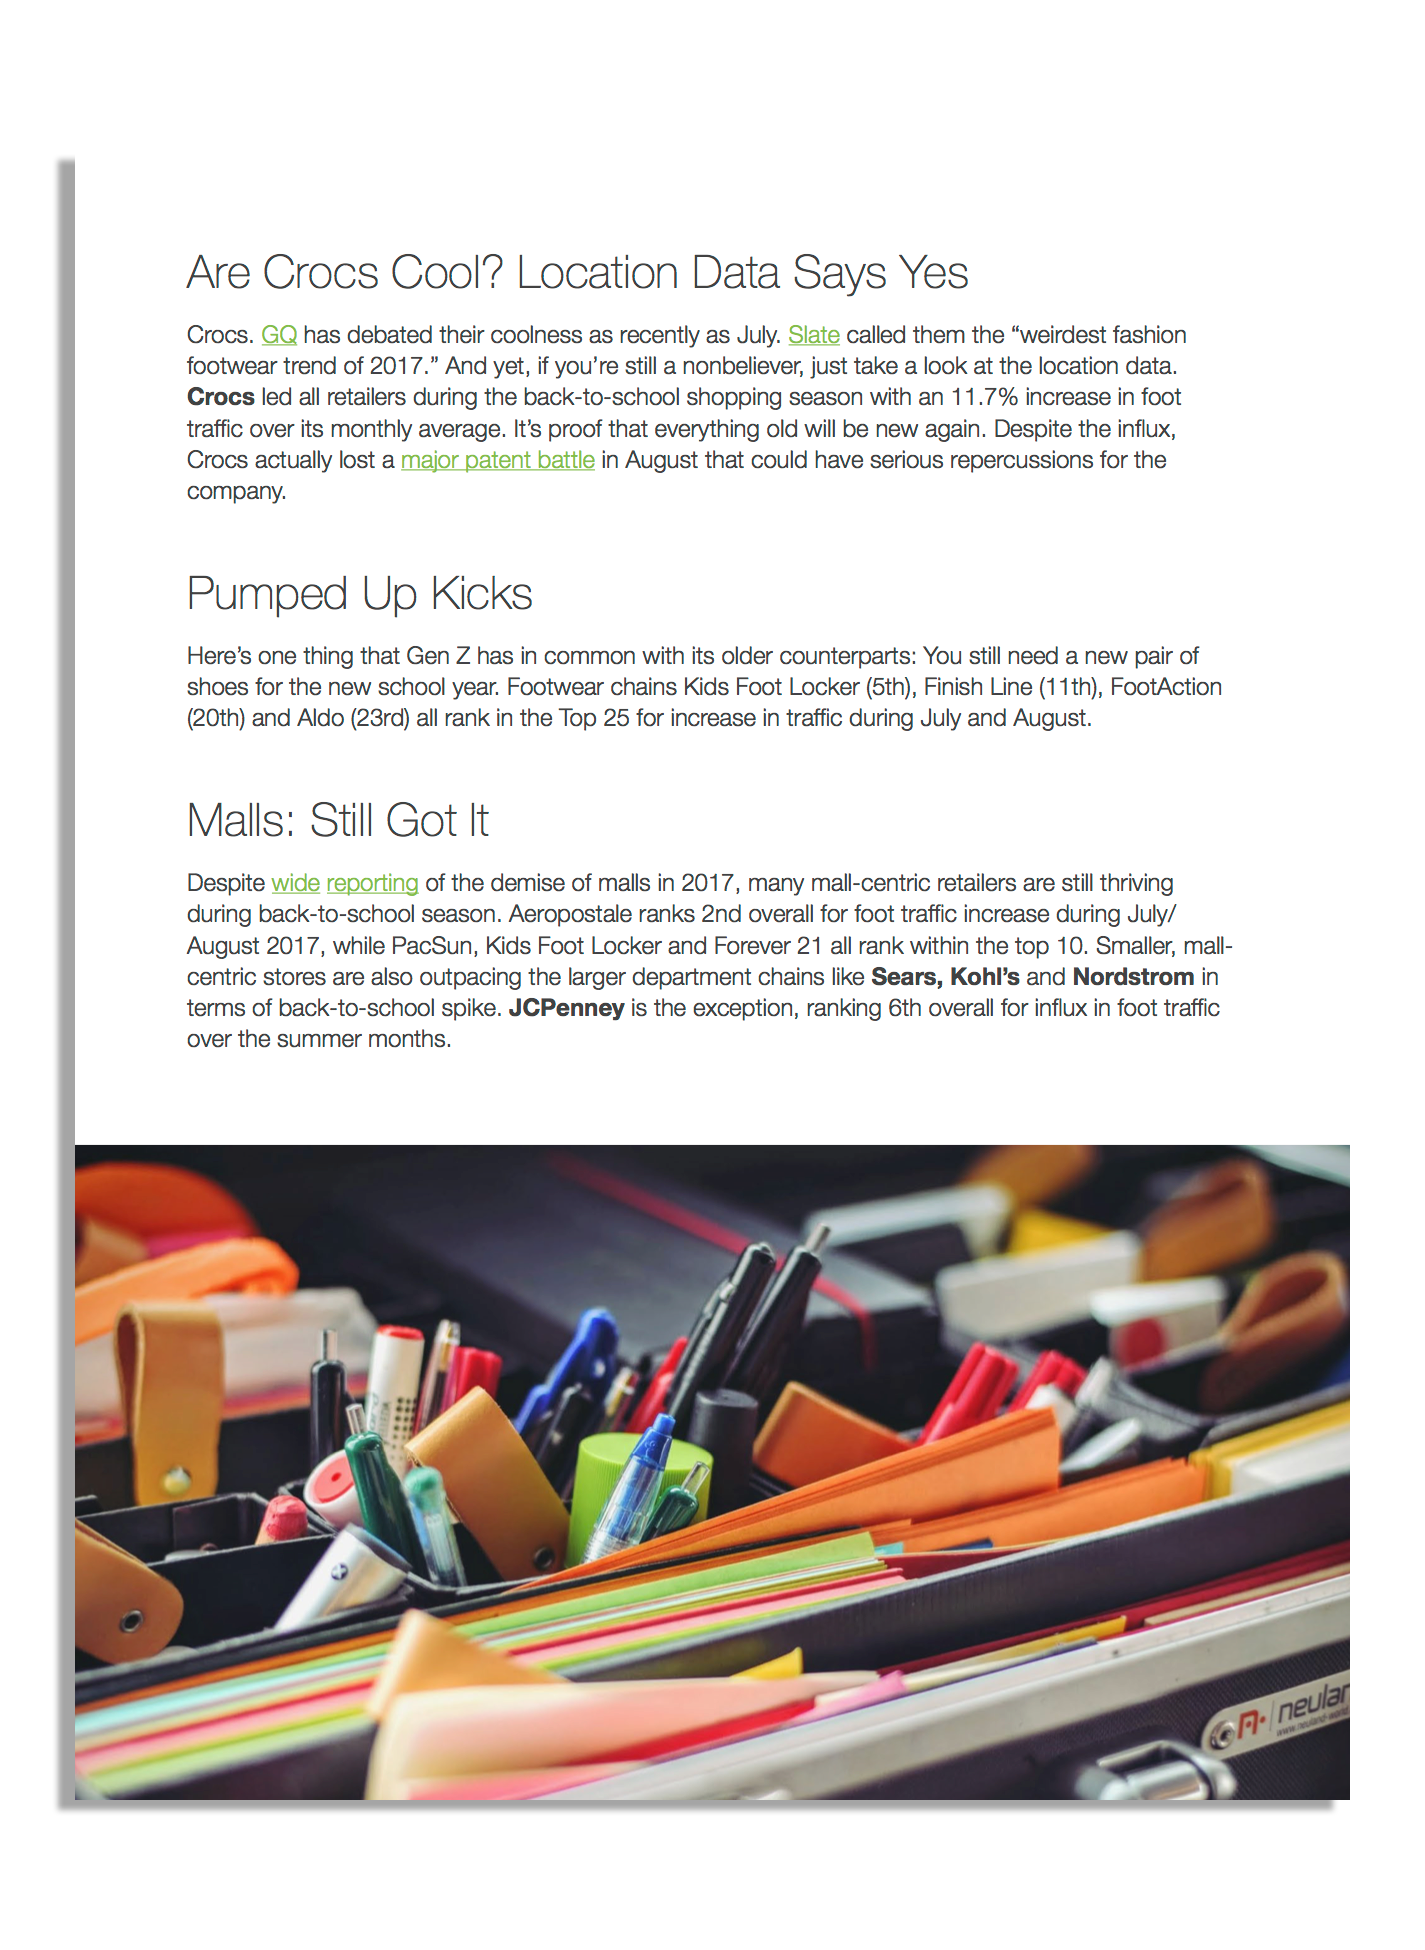
inMarket inSights: Foot Traffic Report: Back to School
In this Back-to-School Foot Traffic Report, we’re utilizing inMarket Location Data to uncover visitation trends at U.S. retailers during July and August, 2017, and to compare that performance against the rest of the year. Download this six page report to see which retailers saw the greatest gains during the back to school rush. |
Download Report Below! × |
|---|
inMarket inSights Report Card: Amazon and Whole Foods
Our first edition inMarket inSights Report Card covers the impact on foot traffic at Whole Foods since Amazon took control on 8/28 -- with a quick look at competitive grocers as well. |
Download Report Below! × |
|---|
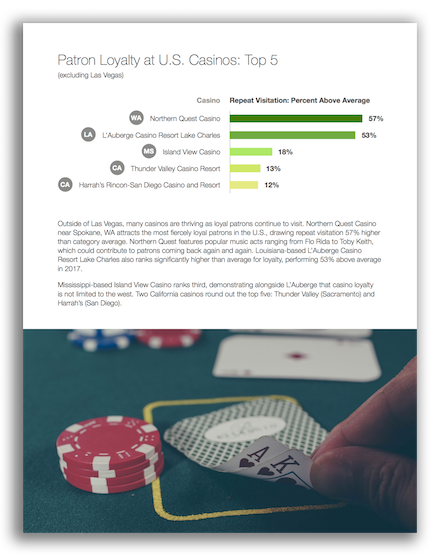
Summer 2017 Loyalty Report: Casinos
In this seven page Loyalty Report for Casinos, we’re using inMarket Location Data to examine which casinos have the best and worst customer loyalty. |
Download Report Below! × |
|---|
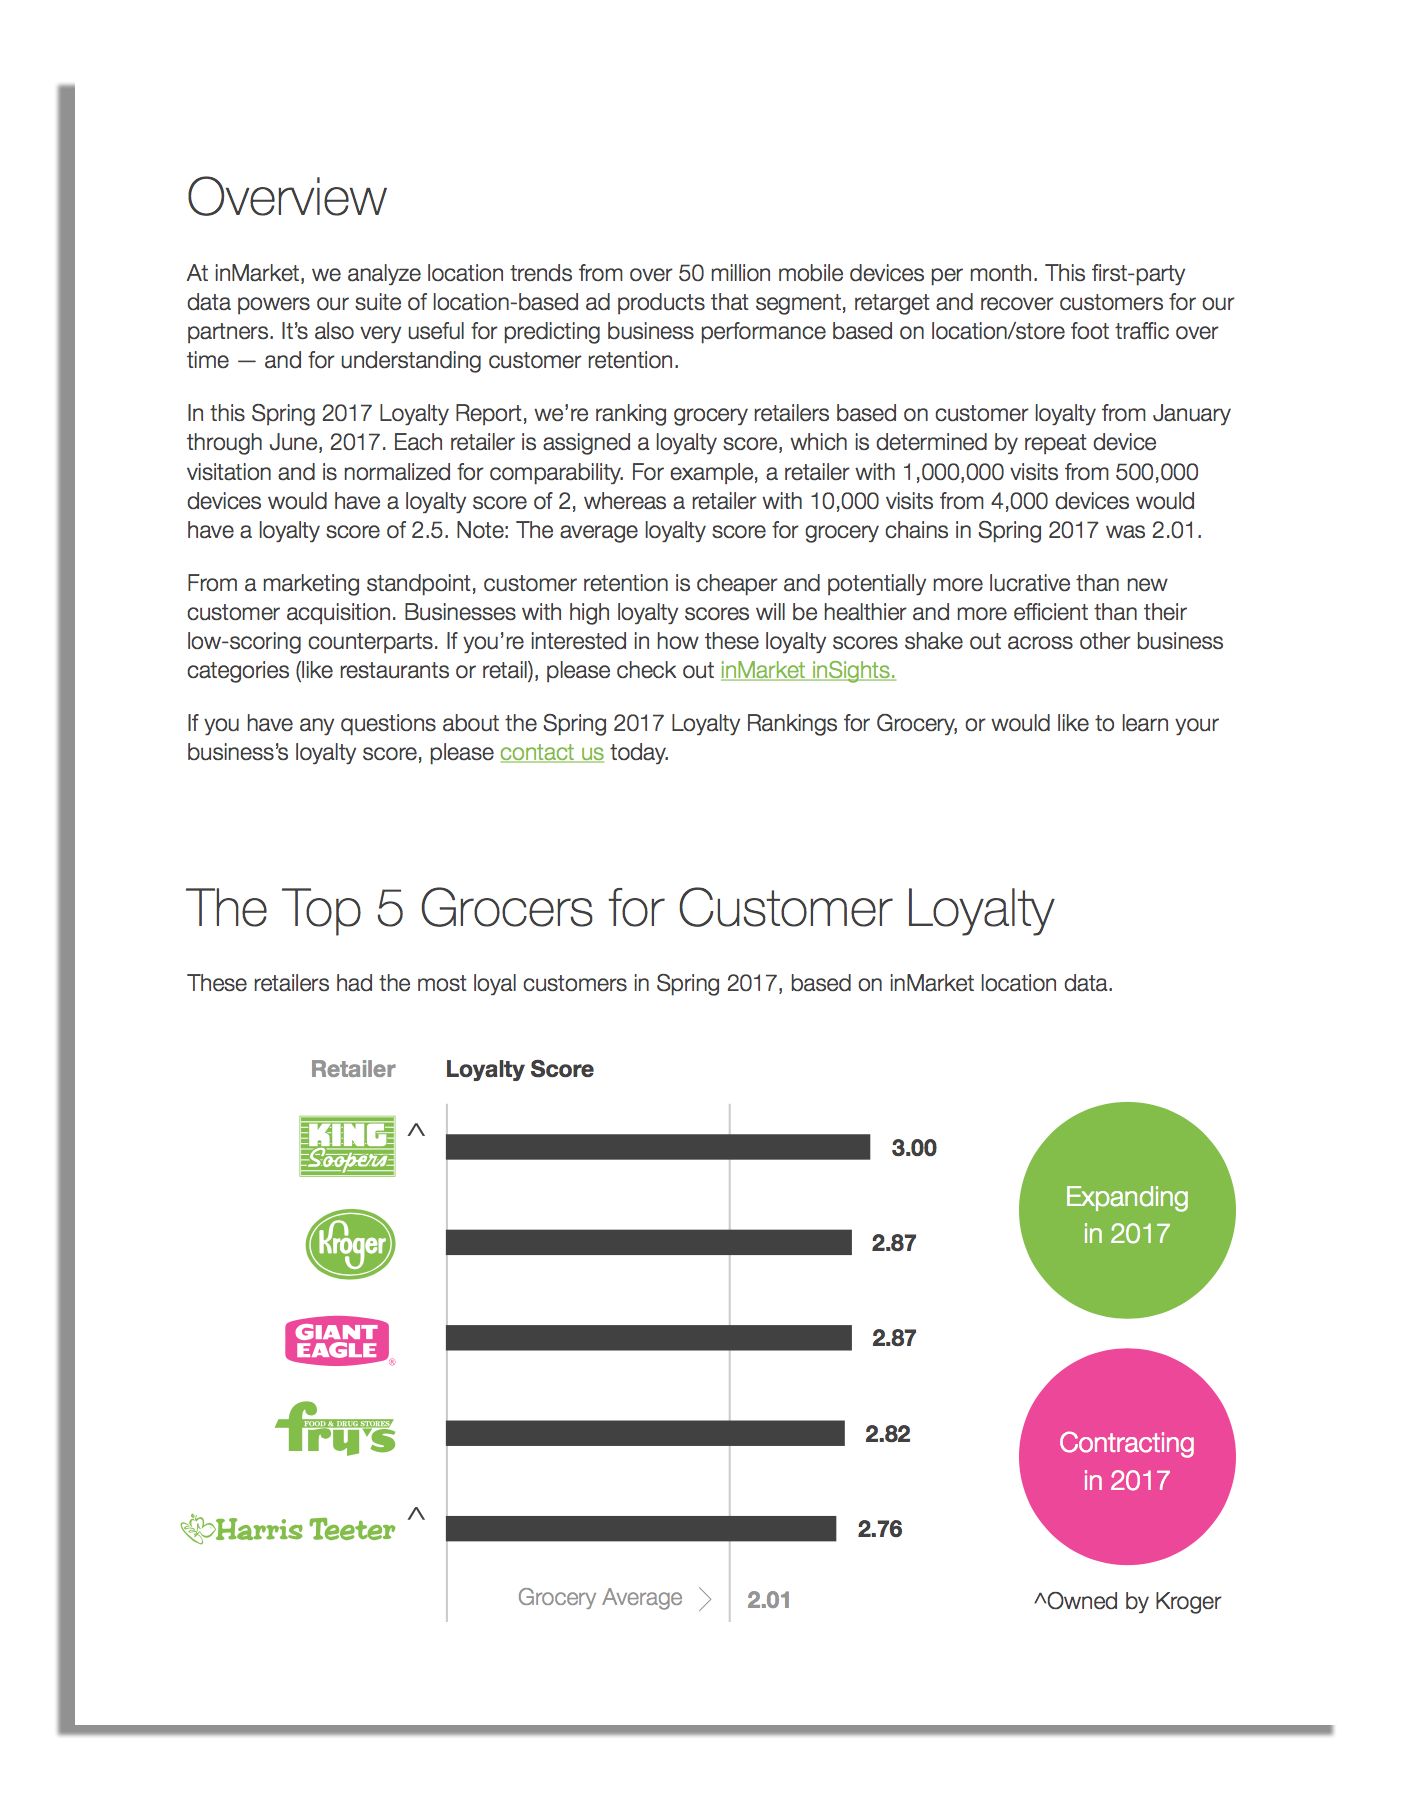
Spring Loyalty Report: Grocery
In our three page Spring 2017 Loyalty Report for Grocery, we’re using inMarket Location Data to examine which grocery chains have the best customer loyalty. |
Download Report Below! × |
|---|
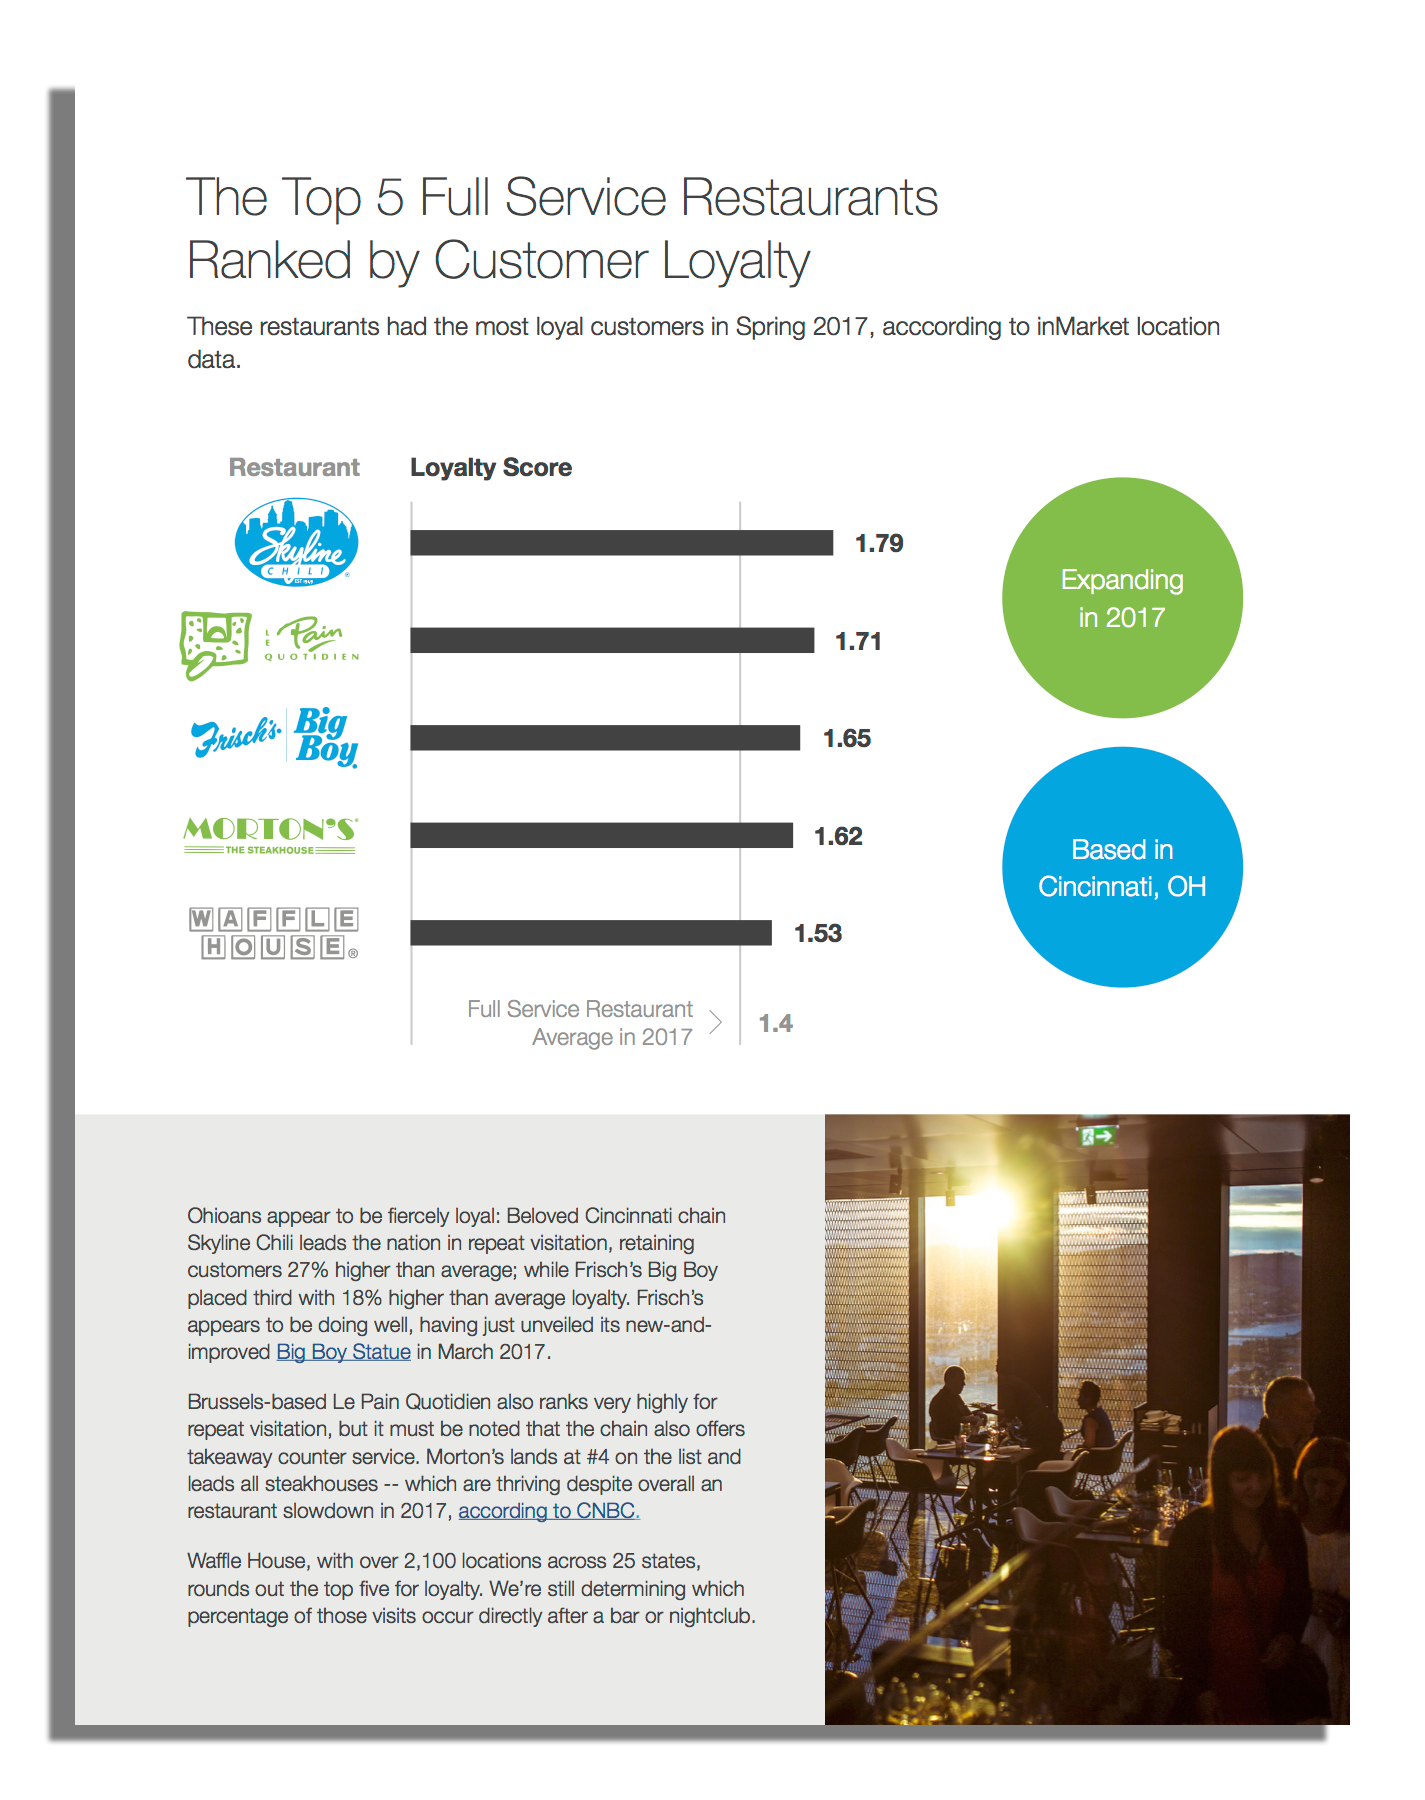
Spring Loyalty Report: Restaurants
In our extended six page Spring 2017 Loyalty Report for Restaurants, we’re using inMarket Location Data to examine the best and worst FSRs and QSRs for customer loyalty. The restaurants on top are thriving, while those toward the bottom are dealing with closures, losses or even bankruptcy. |
Download Report Below! × |
|---|
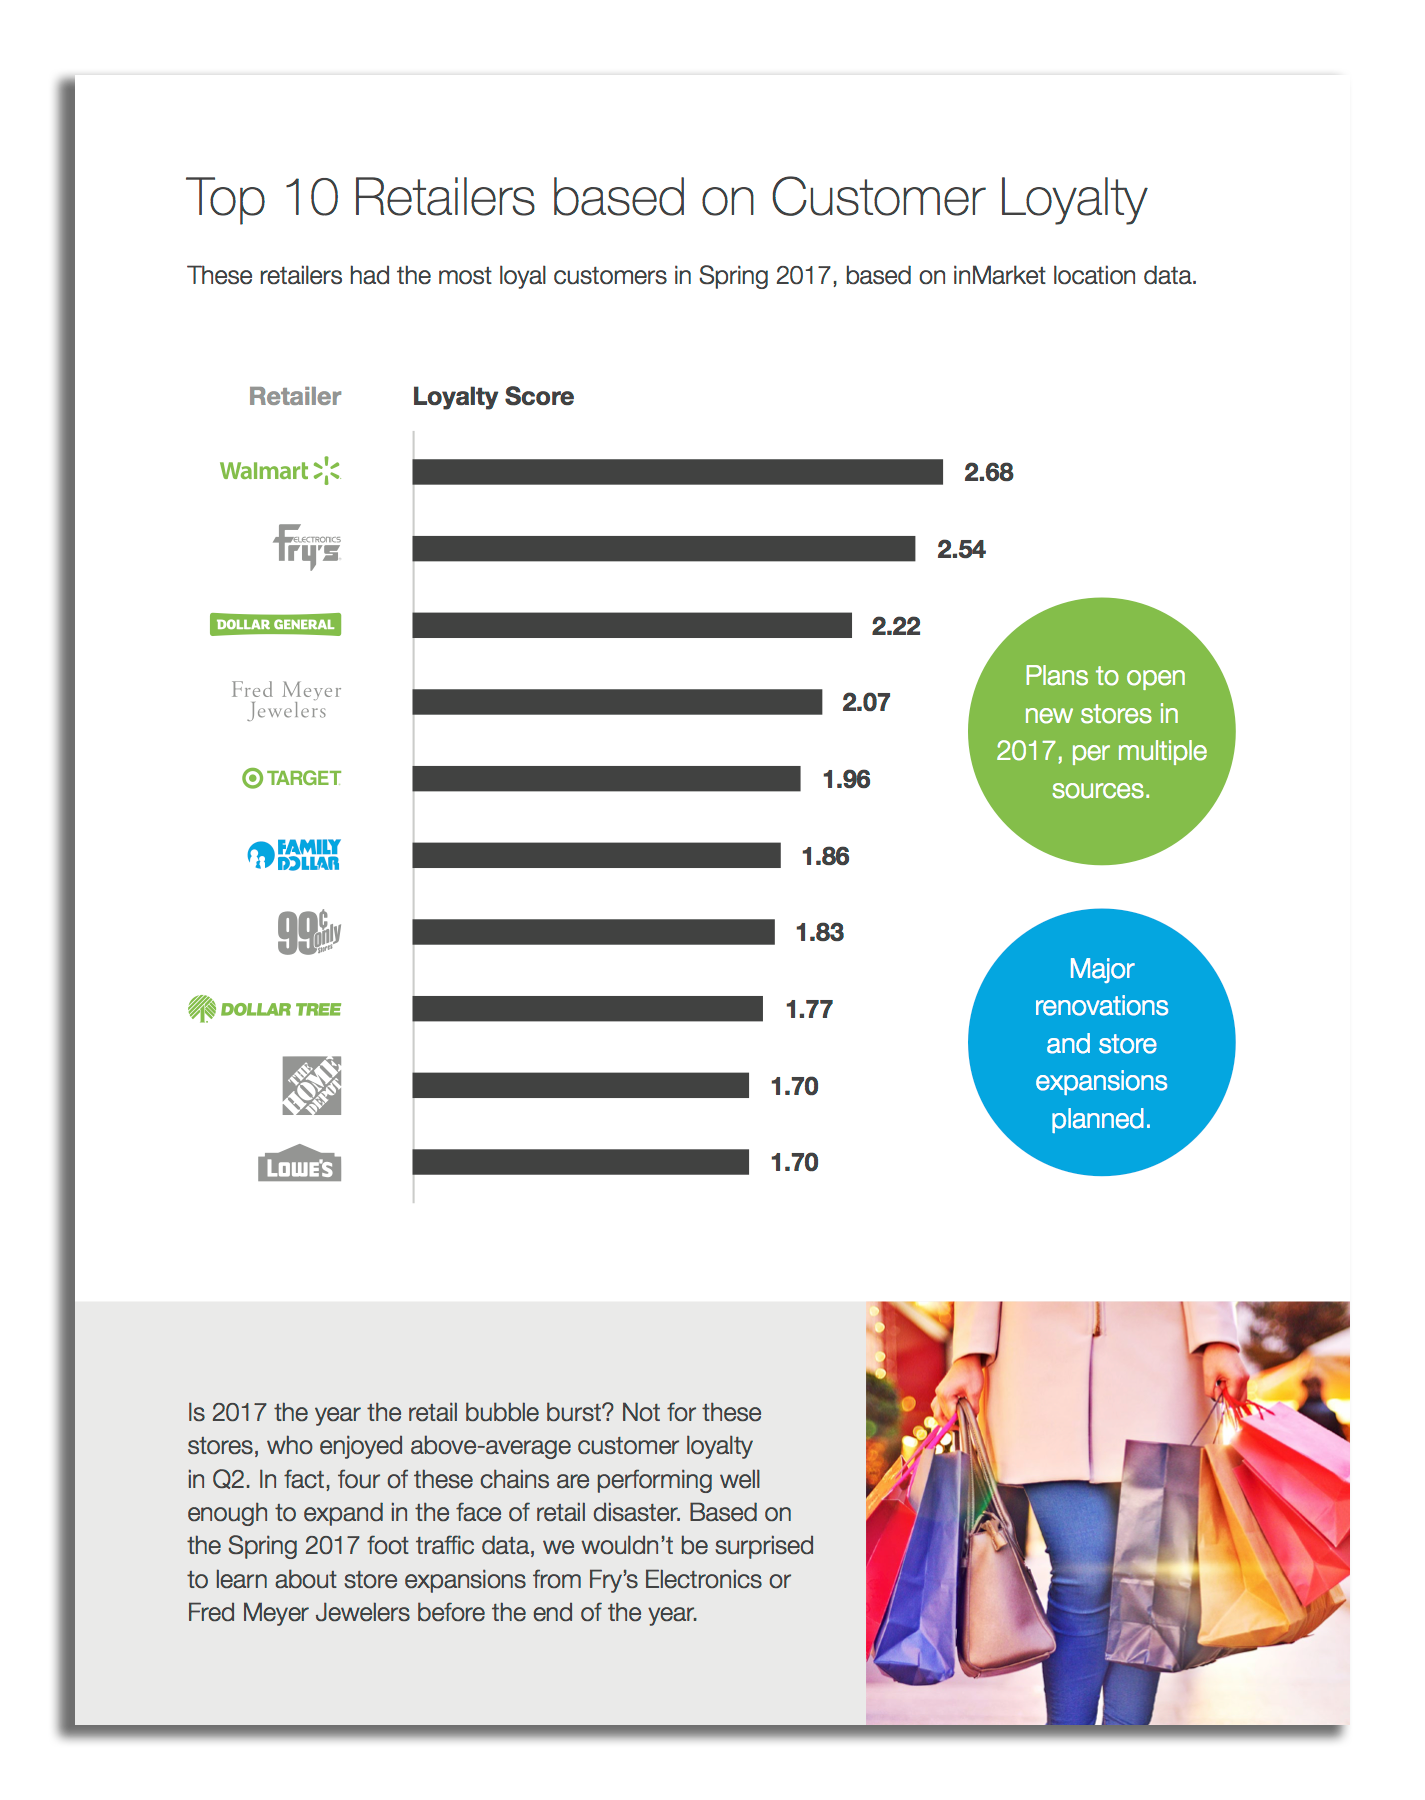
Spring Loyalty Report: Retail
In this four page report, we’re looking specifically at the retail industry, where each week it seems like there’s another round of mass store closures. But despite the “retail-pocolypse,” there are a few retailers that are expanding and thriving. What do they have in common? Loyal customers. In this report, we identify the top 10 and bottom 10 retailers for customer loyalty, based on inMarket location data. |
Download Report Below! × |
|---|
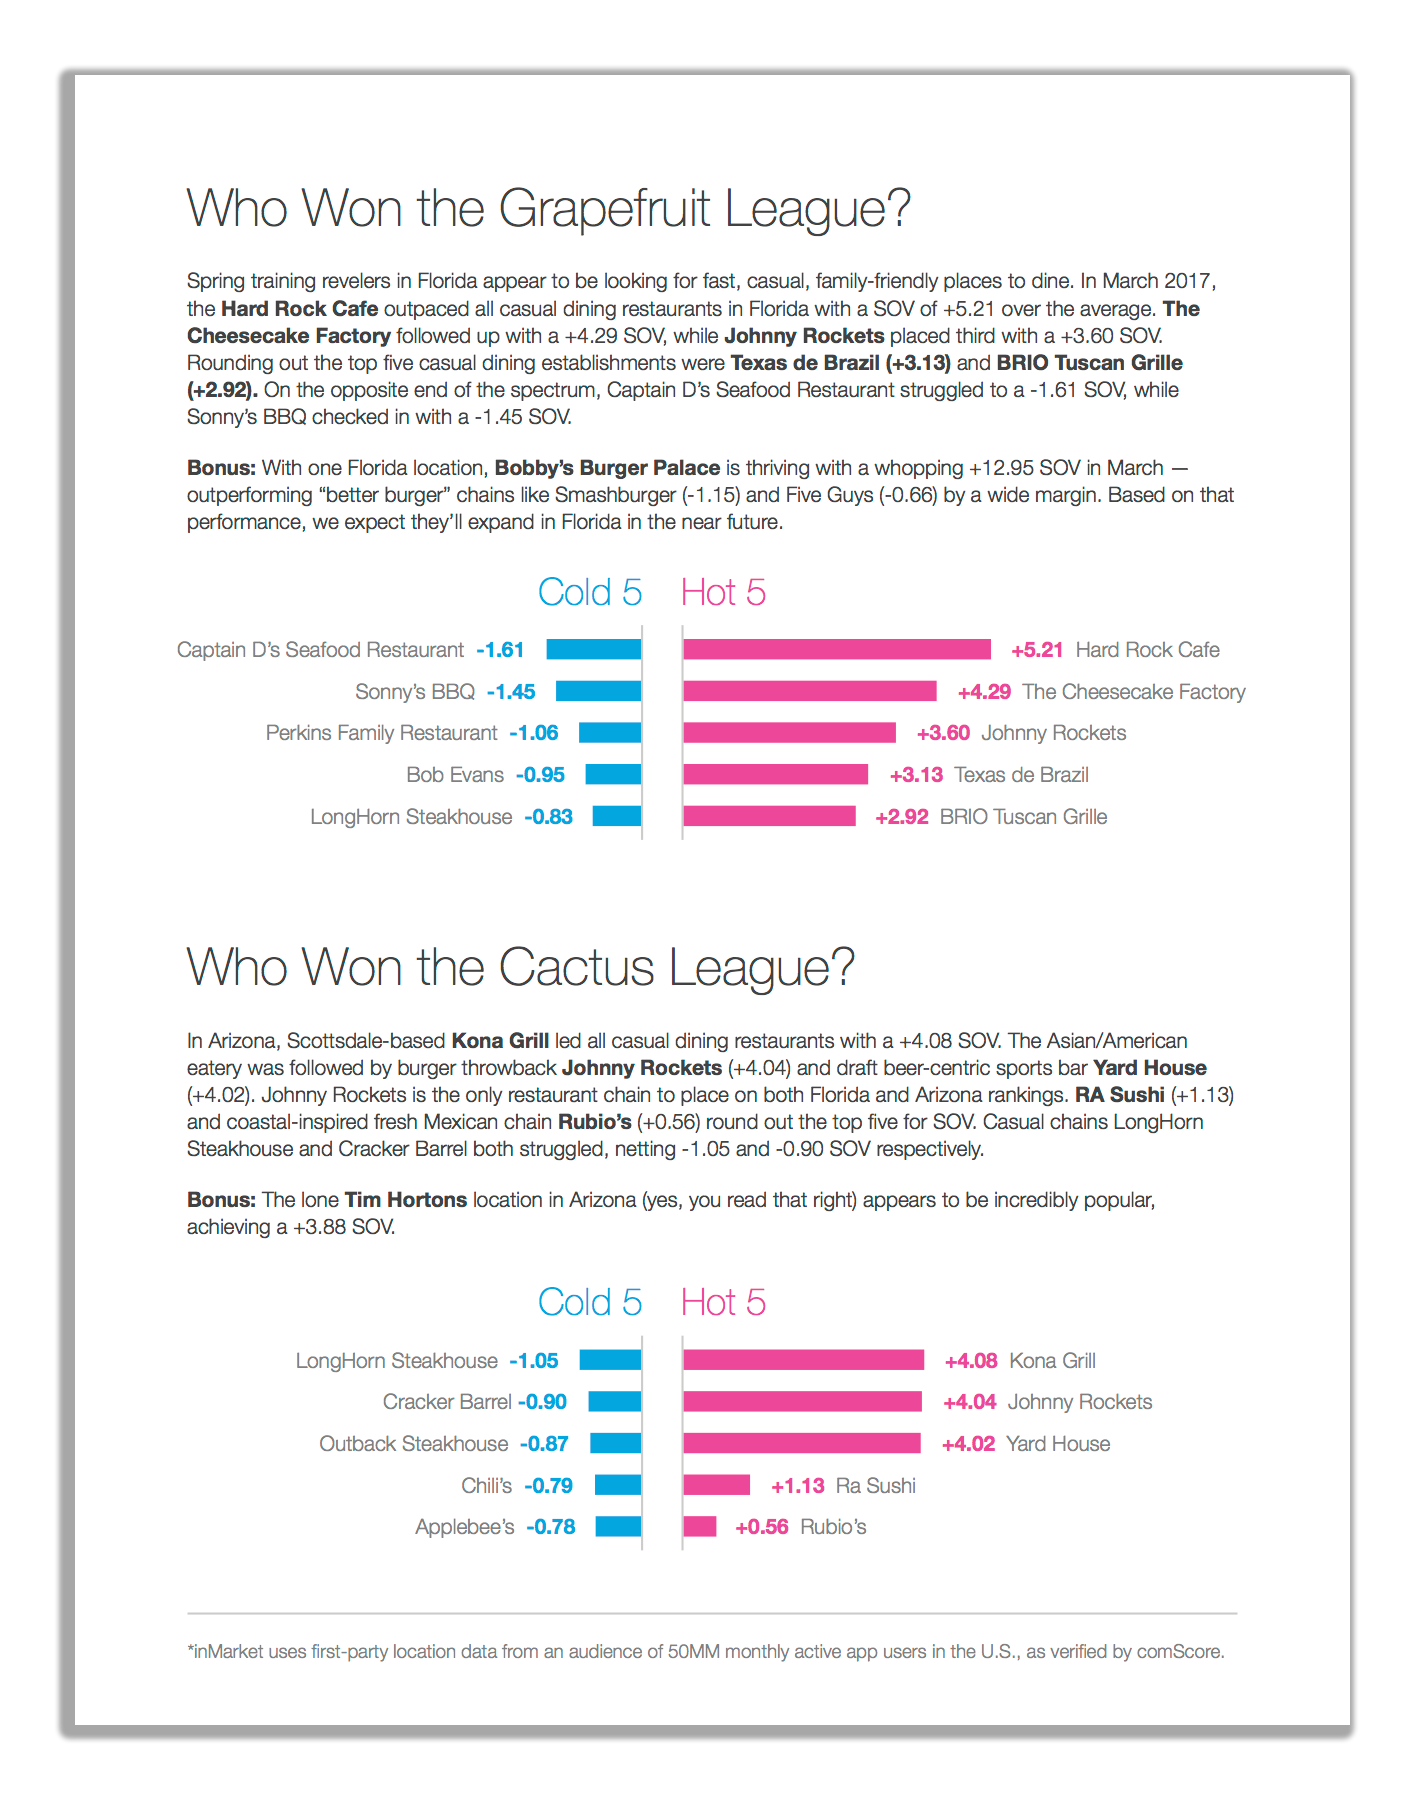
Spring Training Foot Traffic Report for Restaurants
Spring Training is big business for many cities in Florida and Arizona, as teams and their fans make the annual pilgrimage out of the cold to celebrate baseball and sunshine. We’re interested in just how much economic impact spring training has on its host cities and businesses, and we’ve turned to mobile location data to tell the story. This two page report uses inMarket data to rank Florida and Arizona restaurant chains based on their share of visits (SOV) during spring training in March 2017. |
Download Report Below! × |
|---|
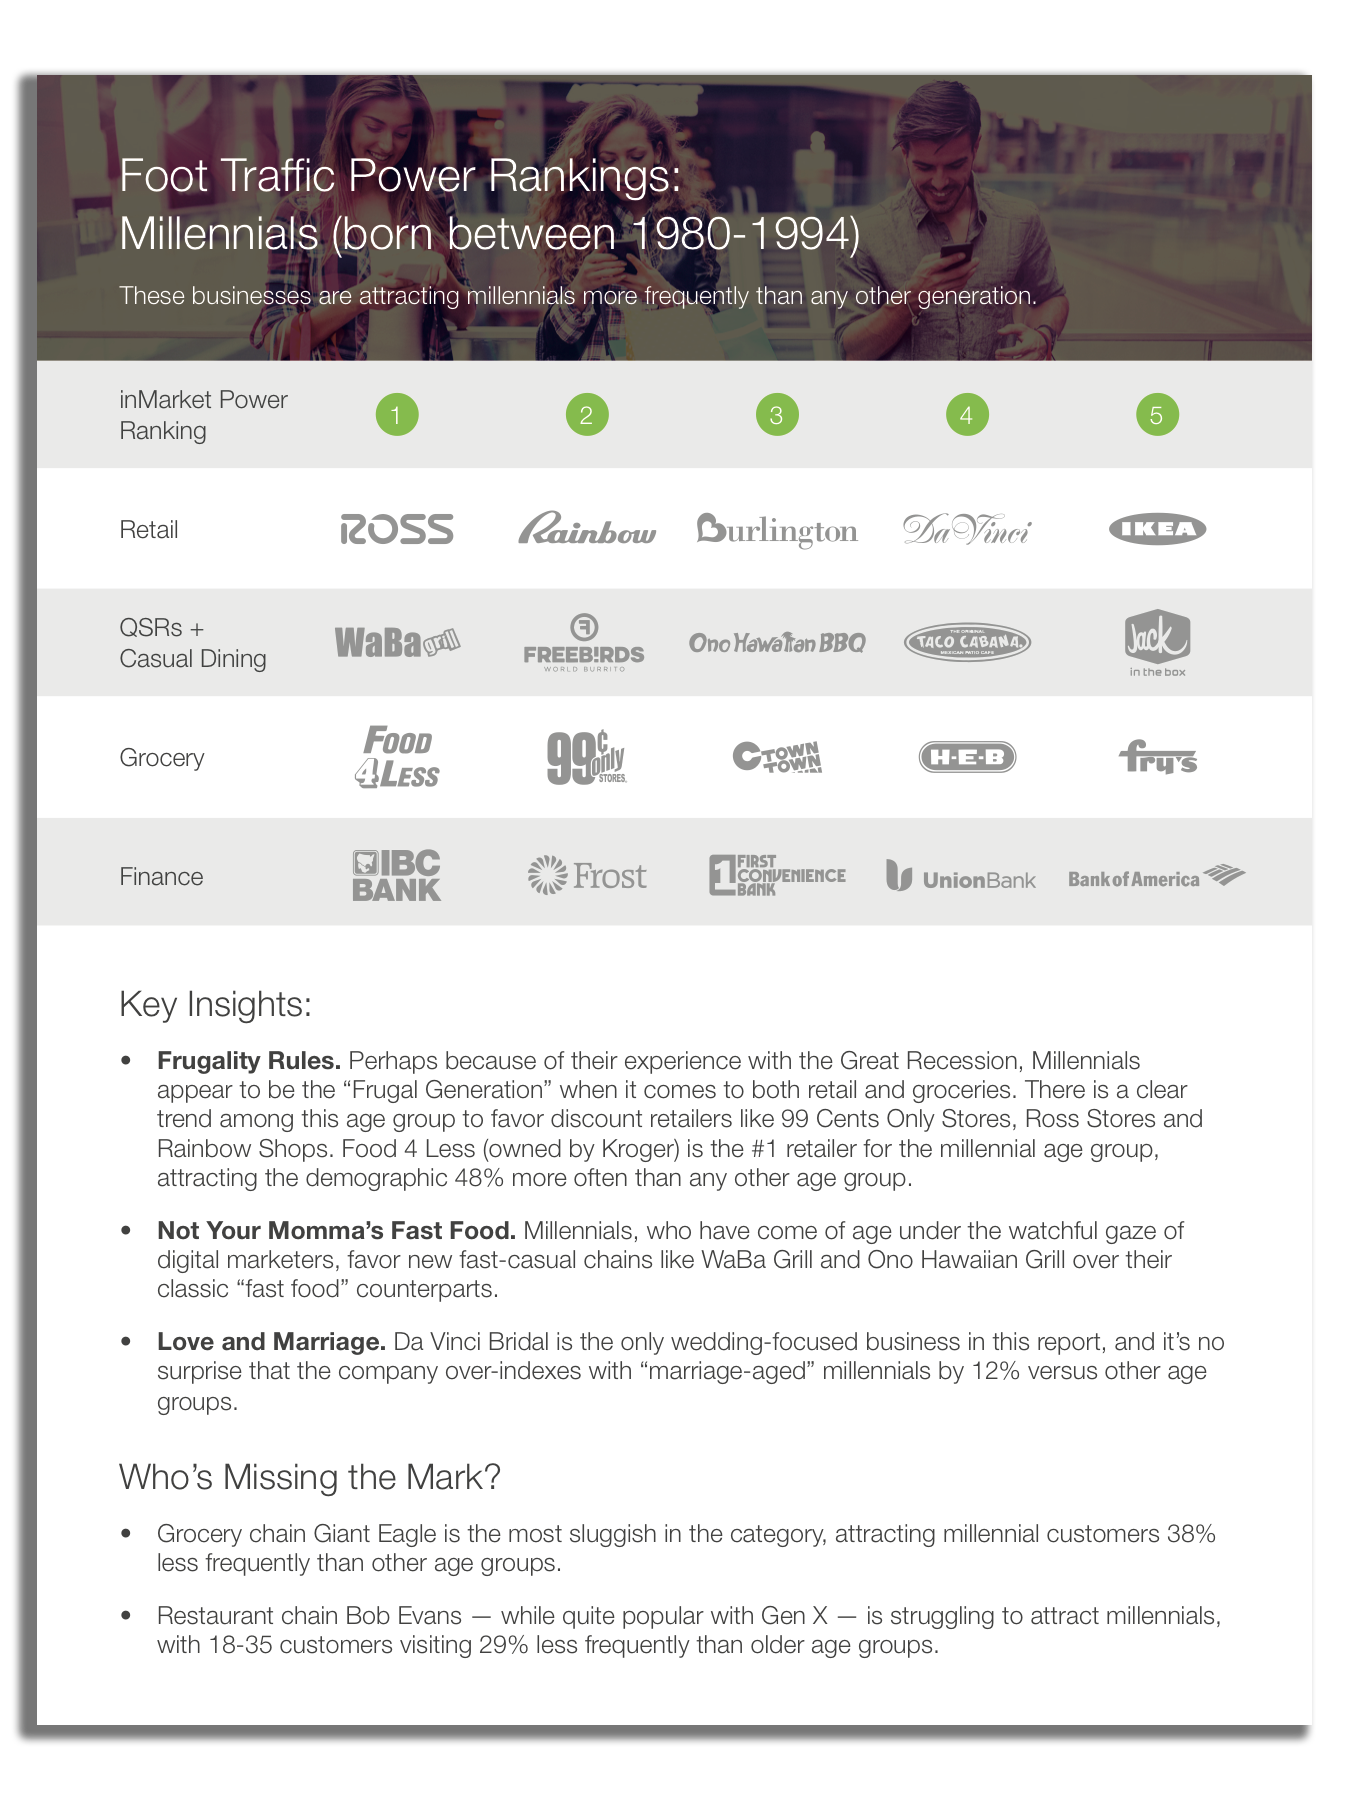
Ranking Businesses Based on Generational Foot Traffic
Thanks to mobile location data, we can now understand where the big four age groups are shopping, dining and doing business en masse. This seven page report ranks businesses from various categories -- like retail, restaurants and finance -- based on their saturation with each generation, and examines major trends within each cohort. |
Download Report Below! × |
|---|
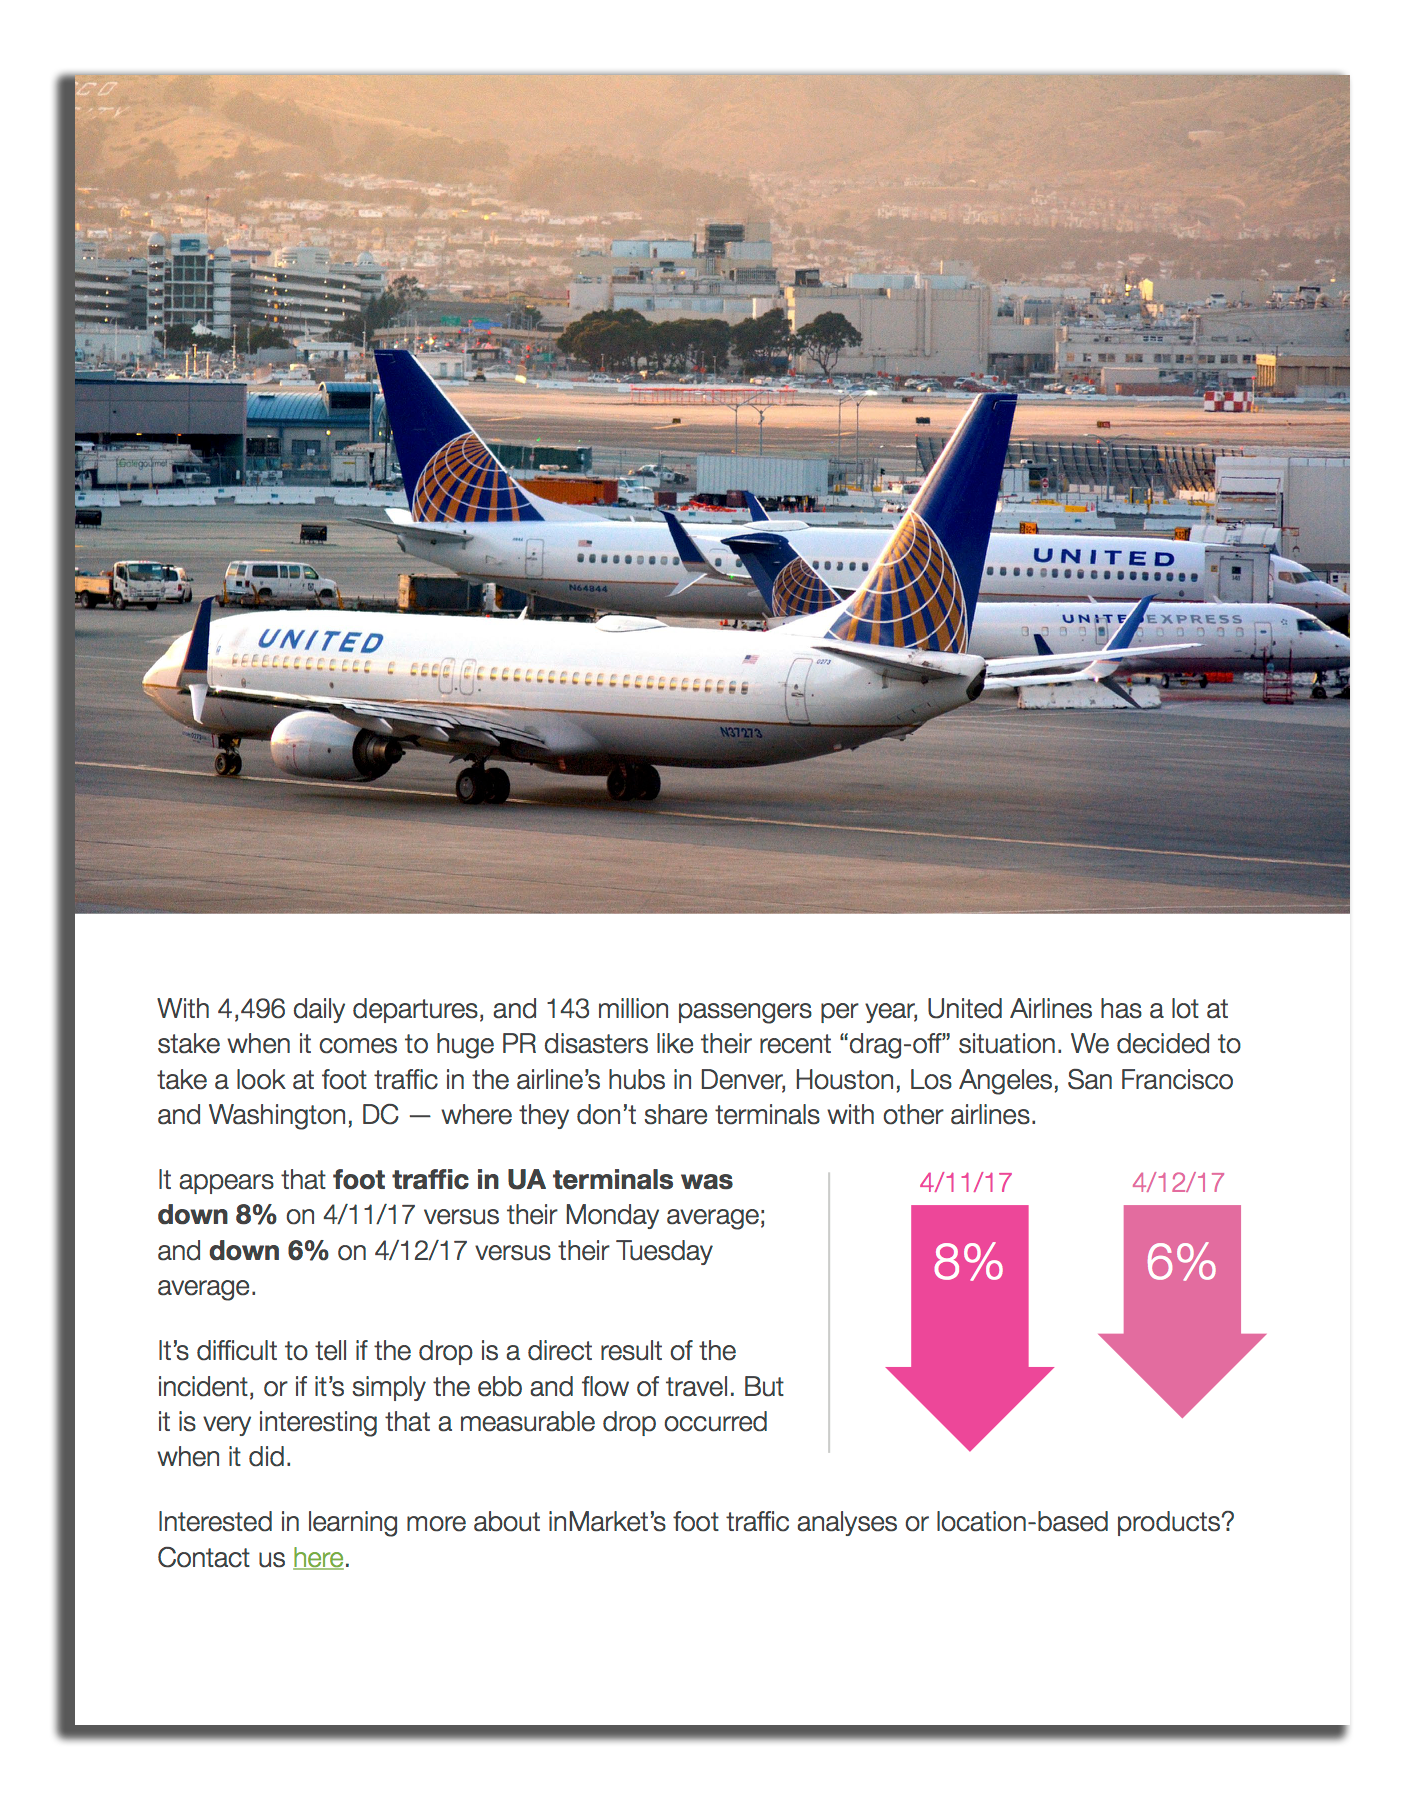
The United Debacle A Foot Traffic Analysis
When the United “drag-off” incident occurred, we decided to measure any changes in foot traffic across the airline's hubs in Denver, Houston, Los Angeles, San Francisco and Washington, DC -- where they don't share terminals with other airlines. The results were fascinating. |
Download Report Below! × |
|---|